Navigation » List of Schools, Subjects, and Courses » Math 138 – Statistics » Homeworks » 3.3 Homework
No Answers We dont have answer to this question yet. If you need help with your homework send us an email  or chat with our tutors
3.3 Homework
3.3 Homework
1. In a study of the maximum distance between gates at a sample of airports, the mean distance was 0.86 miles with a standard deviation of 0.41 miles.
(a)The maximum distance at Minneapolis-St. Paul International Airport is 1.08 miles. What is the z-score of this distance? Round to 2 decimal places
(b)What distance would have a z-score of 1.6?
2. Standardized tests: In a particular year, the mean score on the ACT test was 24.2 and the standard deviation was 4.4. The mean score on the SAT mathematics test was 533 and the standard deviation was 101. The distributions of both scores were approximately bell-shaped. Round the answers to at least two decimal places.
(a) Find the z-score for an ACT score of 24.
(b) Find the z-score for a SAT score of 483.
(c) Which score is higher, relative to its population of scores?
(d) Jose’s ACT score had a z-score of 1.16. What was his ACT score?
(e) Emma’s SAT score had a z-score of -0.9. What was her SAT score?
3. For the data set

(a) Find the first and third quartiles.
(b) Find the IQR
(c) Find the upper and lower outlier boundaries.
(d) List the outliers. If there is more than one outlier, separate them by a comma. Use “None”, if applicable.
4. Hazardous waste: Following is a list of the number of hazardous waste sites in a sample of states of the United States in a recent year. The list has been sorted into numerical order.

Find the first and third quartiles of these data.
Find the median of these data
Find the lower and upper outlier boundaries.
Are there any outliers? If so, list them. Otherwise, select “None.”
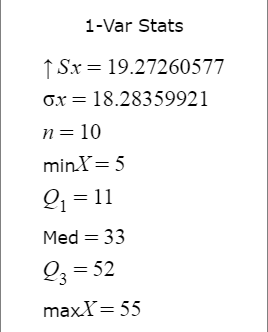
5 The following TI-84 Plus display presents the five-number summary for a data set.

Are there any outliers in this data set?
There _____ outliers in this data set.
6. Hazardous waste: Following is a list of the number of hazardous waste sites in each of the 50 states of the United States in a recent year. The list has been sorted into numerical order. The median is 20, Q1 is 13, and Q3 is 34.

(a) Construct a boxplot for the given data (including outliers if any).
(b)Describe the shape of this distribution.
7 Comparative boxplots: Following are boxplots of the level of fine particles of pollution, in micrograms per cubic meter, measured at various times during a recent winter.

City generally had higher levels of pollution and City had more spread.
 or chat with our tutors
