
Navigation » List of Schools, Subjects, and Courses » Math 11 – Calculus » Module 4 Assessment » Problems 1 to 3
No Answers We dont have answer to this question yet. If you need help with your homework send us an email  or chat with our tutors
Problems 1 to 3
Problems 1 through 3: Analyzing Call Option Premiums A call option is a type of financial contract that gives the owner the right to purchase an asset at a specified price (called the strike price) within a specific time period. Suppose you buy a call option contract with a $25 strike price for a fake company called “Calculus Learners Inc.” (which we will abbreviate with the fake stock ticker CALC) – at any time before the expiration of the contract, you may choose to exercise the option and buy 100 shares of CALC (called the underlying asset) at $25 per share, regardless of the price that the shares are selling on the stock market. If CALC is trading at less than $25 per share on the market, the option is considered out of the money (abbreviated OTM) – the market value is lower than the strike price and you are unlikely to want to exercise the option. If CALC is trading at more than $25 per share on the market, the option is considered in the money (abbreviated ITM) – the market value is higher than the strike price, and you might consider exercising the option or selling the contract to someone else for a profit. If CALC is trading at $25 per share on the market, the option is considered at the money (abbreviated ATM) – the market value and the strike price are equal.
Whether you choose to exercise the option or not, there is still a cost associated with purchasing the contract in the first place. Options that are OTM are less expensive to purchase than options that are ITM, in part because there is little incentive to exercise OTM options; the contract may end up expiring without being exercised and you will have lost the premium you paid for the contract. Over time, the value of the contract will change as the price of the underlying asset changes and as time gets closer to the expiration date. Some traders never actually exercise options, but rather buy and sell the contracts to take advantage of the fluctuating premium. Other investors buy and sell options as “insurance” (also called a hedge) to help reduce the risk of their investments. There are many factors that go into making decisions when buying, selling, and exercising options, but we would like to focus on just the price of the contract itself (the premium).
Problem 1 Let us once again consider a call option contract for 100 shares of CALC at a $25 strike price. The graph below shows the price of the option contract as a function of the price of CALC shares.
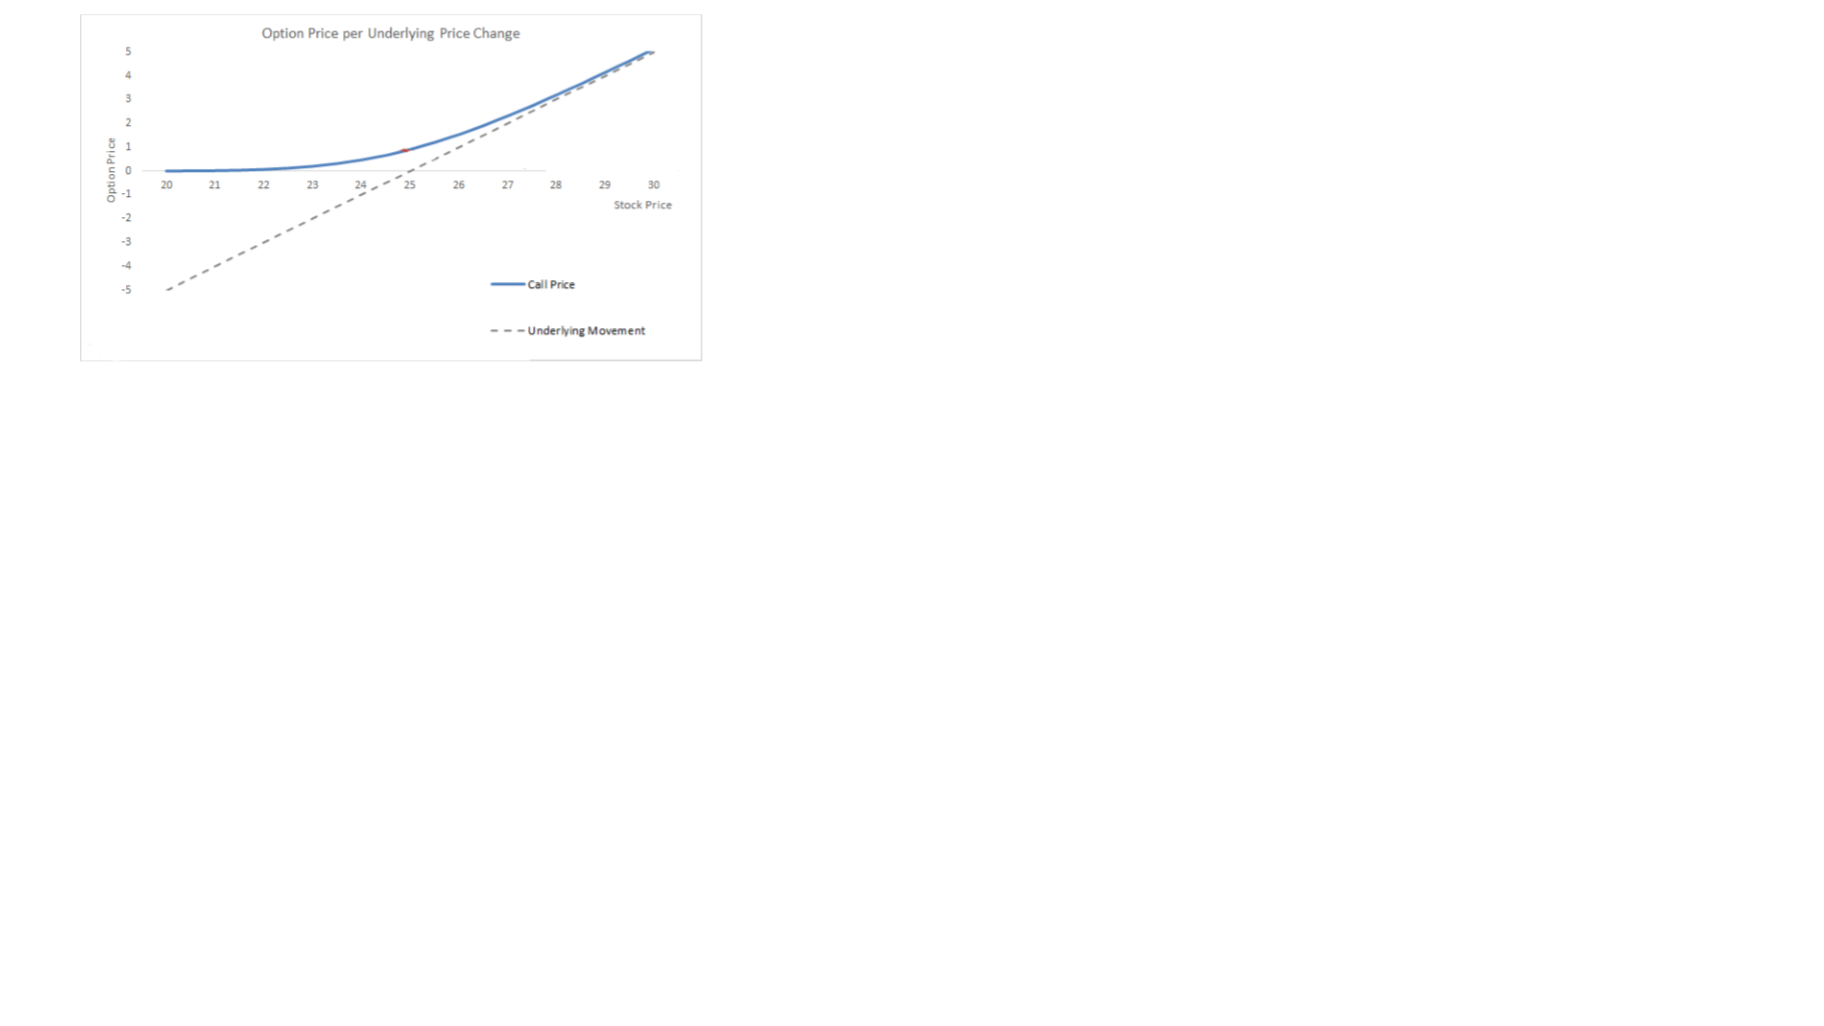
Traders use the word “delta” to refer to the rate of change of the option price relative to the underlying stock price.
i. Based on what we have learned about the language and notation of calculus, why might this measure be called “delta”? ii. Recall that the strike price of this option is $25. Based on the graph, which of the following is larger: delta when this option is OTM or delta when this option is ITM? What feature(s) of the graph help you make this determination? iii. Notice that as the stock price increases, the call price starts to approach the “underlying movement” line; this line represents a dollar-for-dollar increase in the price of the underlying shares of CALC. We call this type of behavior an oblique asymptote. What does this asymptote tell us about delta as the option goes deeper “in the money”?
Problem 2 The rate of change of delta for an option is called gamma. The following graph shows two curves: one for delta versus the underlying price and the other for gamma versus the underlying price:
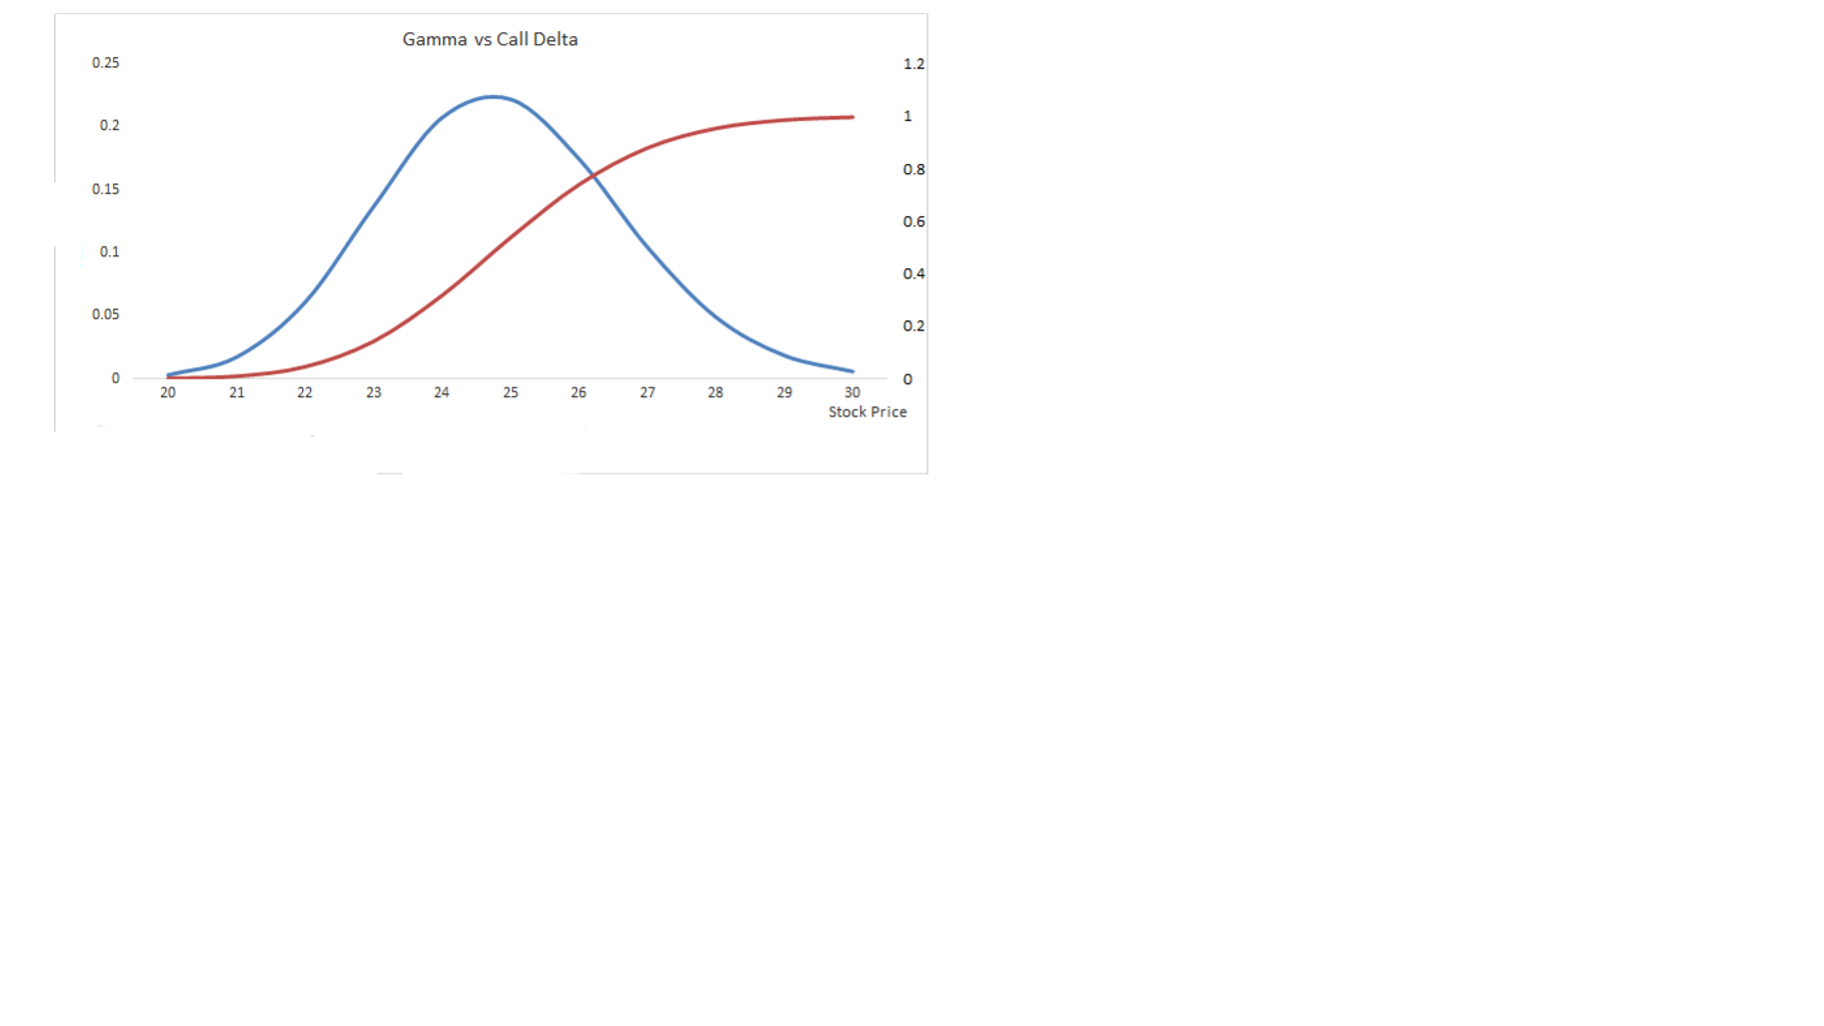
i. Suppose P(u) is a function that takes the underlying price of CALC shares as an input and gives the premium of the $25 strike call option as an output. How could we represent delta and gamma using calculus notation? ii. In the given graph, which curve represents delta and which curve represents gamma? How can you tell? Explain your answer by referencing specific graphical features.
Problem 3 Speed is the rate of change of gamma with respect to the underlying price. Using the graph of gamma from problem 2, sketch the graph of speed. Try your best to clearly indicate the locations of local extrema and intercepts (if any).
Problems 4 through 7: Sketching a Graph by Hand Using Calculus The following problems will walk you through a step-by-step procedure for graphing the function
𝑓(𝑥) = 4𝑥1/3 − 𝑥4/3
You must justify your answers with proper algebra and calculus. Try to skip as few steps as possible so that it is clear how you are arriving at each answer.
Problem 4 Find the x- and y- intercepts.
Problem 5 Determine the intervals on which f is increasing and decreasing. In addition, find the coordinates of any relative extrema and indicate whether each corresponds to a local minimum or local maximum.
Problem 6 Determine the intervals on which f is concave up and concave down. In addition, find the coordinates of any inflection points.
Problem 7 Using the information from problems 4 through 6, draw a sketch of the graph. Be sure to label each of the points that you found in the previous problems.
or chat with our tutors