
Navigation » List of Schools, Subjects, and Courses » Math 10 – Introduction to Statistics » Section 9.1 Homework » Section 9.1 Homework Question 4
With Answers Good news! We are showing you only an excerpt of our suggested answer to this question. Should you need our help in customizing an answer to this question, feel free to send us an email at  or chat with our customer service representative.
Section 9.1 Homework Question 4
Section 9.1 Homework
4. A study was conducted to determine the proportion of people who dream in black and white instead of color. Among 298 people over the age of 55, 67 dream in black and white, and among 293 people under the age of 25, 12 dream in black and white. Use a 0.05 significance level to test the claim that the proportion of people over 55 who dream in black and white is greater than the proportion for those under 25. Complete parts (a) through (c) below.
Test the claim using a hypothesis test.
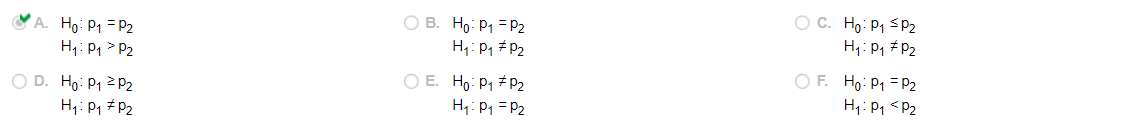
Consider the first sample to be the sample of people over the age of 55 and the second sample to be the sample of people under the age of 25. What are the null and alternative hypotheses for the hypothesis test?
Identify the test statistic.
z=
Identify the P-value.
P-value =
What is the conclusion based on the hypothesis test?
The P-value is _______ the significance level of á=0.05, so __________ the null hypothesis. There is ____ the null hypothesis. There is evidence to support the claim that the proportion of people over 55 who dream in black and white is greater than the proportion for those under 25.
Test the claim by constructing an appropriate confidence interval.
The 90% confidence interval is
What is the conclusion based on the confidence interval?
Because the confidence interval limits _________0, it appears that the two proportions are ________ Because the confidence interval limits include ______ values, it appears that the proportion of people over 55 who dream in black and white is ______ the proportion for those under 25.
An explanation for the results is that those over the age of 55 grew up exposed to media that was displayed in black and white. Can these results be used to verify that explanation?
- Yes. The results can be used to verify the given explanation because the difference in proportions is statistically significant.
- No. The results speak to a possible difference between the proportions of people over 55 and under 25 who dream in black and white, but the results cannot be used to verify the cause of such a difference.
- No. The results speak to a possible difference between the proportions of people over 55 and under 25 who dream in black and white, but the results are not statistically significant enough to verify the cause of such a difference.
- Yes. The results can be used to verify the given explanation because the difference in proportions is practically significant.