
Navigation » List of Schools, Subjects, and Courses » Math 227 – Statistics » Chapter 3 Review Homework » Chapter 3 Review Homework Question 23
With Answers Good news! We are showing you only an excerpt of our suggested answer to this question. Should you need our help in customizing an answer to this question, feel free to send us an email at  or chat with our customer service representative.
Chapter 3 Review Homework Question 23
Question
Chapter 3 Review Homework
23.
The table shows the weekly income of 20 randomly selected full-time students. If the student did not work, a zero was entered.
(a) Check the data set for outliers.
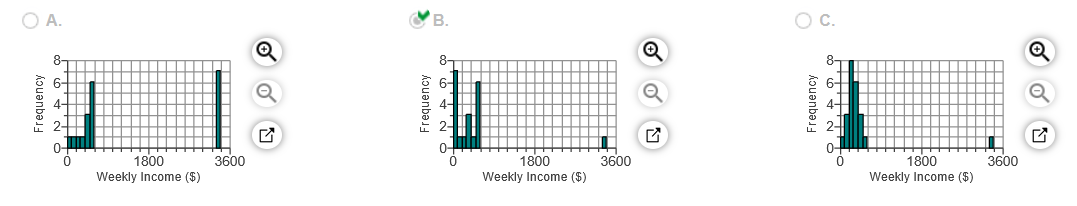
(b) Draw a histogram of the data.
(c) Provide an explanation for any outliers.
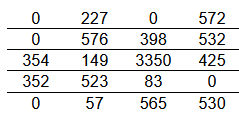
(a) List all the outliers in the given data set. Select the correct choice below and fill in any answer boxes in your choice.
- The outlier(s) is/are ______
- There are no outliers.
B Choose the correct histogram below.
This question is taken from Math 227 – Statistics » Summer 2021 » Chapter 3 Review Homework