
Navigation » List of Schools, Subjects, and Courses » Math 136 – Introduction to Statistics » Homework » Section 2.1 Question 3
No Answers We dont have answer to this question yet. If you need help with your homework send us an email  or chat with our tutors
Section 2.1 Question 3
The following Pareto chart shows the position played by the most valuable player (MVP) in a certain baseball league for the last 56 years. Use the chart to answer parts (a) through (d).
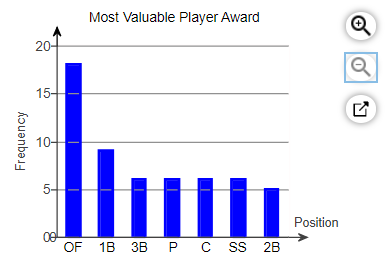
(a) Which position had the most MVPs?The position with the most MVPs was ___________
(b) How many MVPs played pitcher (P)? _____ MVPs played pitcher.
(c) How many more MVPs played outfield (OF) than pitcher? ______ more MVPs played outfield than pitcher. (Type a whole number.)
(d) There are three outfield positions (left field, center field, right field). Given this, how might the graph be misleading?
- The positions or combinations of positions should be chosen so that all the bars are closer together in height.
- The graph is misleading because the bars are decreasing in height from left to right.
- The chart seems to show that one position has many more MVPs because three positions are combined into one. They should be separated.
- All the information is true, so the graph is not misleading.
or chat with our tutors