
Navigation » List of Schools, Subjects, and Courses » Math 120 – Introductory Probability and Statistics » Homeworks » Homework 1
With Answers Good news! We are showing you only an excerpt of our suggested answer to this question. Should you need our help in customizing an answer to this question, feel free to send us an email at  or chat with our customer service representative.
Homework 1
Homework 1
Drag each word or phrase given above into the appropriate definition below.
A numerical summary of a sample. Statistic
Organizing and summarizing data through tables, graphs, and numerical summaries. Descriptive Statistics
The science of collecting, organizing, summarizing, and analyzing information to draw conclusions or answer questions. It is also about providing a measure of confidence in any conclusions. Statistics
A subset of the group of individuals that is being studied. Sample
Uses methods that take results from a sample and extends them to the population, and measures the reliability of the result. Inferential Statistics
A person or object that is a member of the group being studied. Individual
A numerical summary of a population. Parameter
The entire group of individuals to be studied. Population
2. Drag each word or phrase given above into the appropriate definition below.
Provide numerical measures of individuals. The measures can be added or subtracted, and provide meaningful results. Quantitative Variable
Allow for classification of individuals based on some attribute or characteristic. Qualitative Variable
The characteristics of the individuals within the population. Variable
Information that describes characteristics of an individual. Data
Has either a finite number of possible values or countable number of possible values. The values of these variables typically result from counting. Discrete Variable
Has an infinite number of possible values that are not countable. The values of these variables typically result from measurement. Continuous Variable
- Is the variable qualitative or quantitative?
- The variable is quantitative because it is a numerical measure.
- The variable is quantitative because it is an attribute characteristic.
- The variable is qualitative because it is a numerical measure.
- The variable is qualitative because it is an attribute characteristic.
4. Determine whether the variable is qualitative or quantitative. Miles per hour at which a car is traveling
- Is the variable qualitative or quantitative?
- The variable is quantitative because it is an attribute characteristic.
- The variable is quantitative because it is a numerical measure.
- The variable is qualitative because it is an attribute characteristic.
- The variable is qualitative because it is a numerical measure.
5. Determine whether the quantitative variable is discrete or continuous. Number of beats in a song
Is the variable discrete or continuous?
- The variable is continuous because it is countable.
- The variable is discrete because it is countable.
- The variable is continuous because it is not countable.
- The variable is discrete because it is not countable.
6. Determine whether the quantitative variable is discrete or continuous. Weight of a child
Is the variable discrete or continuous?
- The variable is continuous because it is countable.
- The variable is continuous because it is not countable.
- The variable is discrete because it is countable.
- The variable is discrete because it is not countable.
7 Determine the level of measurement of the variable. Nation of origin
Choose the correct level of measurement.
- Interval
- Ratio
- Nominal
- Ordinal
Choose the correct answer below.
- Ratio
- Nominal
- Interval
- Ordinal
Choose the correct answer below.
- Ratio
- Nominal
- Ordinal
- Interval
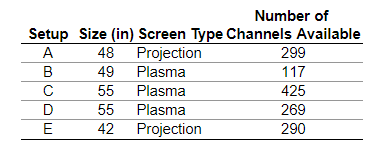
What are the individuals being studied?
- Plasma and projection widescreen high-definition televisions.
- Television setups that include more than 100 channels.
- Televisions with screen sizes between 40 in and 60 in.
- The high-definition television setups A through E.
What are the variables and their corresponding data being studied?
- Size (48, 49, 55, 55, 42), screen type (Projection, Plasma, Plasma, Plasma, Projection), and number of channels available (299, 117, 425, 269, 290)
- Setup (A, B, C, D, E), size (48, 49, 55, 55, 42), screen type (Projection, Plasma, Plasma, Plasma, Projection), and number of channels available (299, 117, 425, 269, 290)
- Size (48, 49, 55, 55, 42) and number of channels available (299, 117, 425, 269, 290)Determine whether each variable is qualitative, continuous, or discrete.
Size is a _____ variable
Screen type is a _____ variable.
Number of channels available is a _____ variable
adults ages 18 years or older in a certain country, August
2, 2015. The respondents were asked, “Of every tax dollar that goes to the federal government, how many cents of each dollar would you say are wasted?” The four possible responses are that the federal government wastes less than 10 cents, between 11 cents and 25 cents, between 26 cents and 50 cents, or 51 cents or more. Of the
individuals surveyed,
indicated that 51 cents or more is wasted. The news service reported that
of all adults in the country 18 years or older believe the federal government wastes at least 51 cents of each dollar spent, with a margin of error of
and a
level of confidence. Complete parts (a) through (e) below.
(a) What is the research objective?
- To determine the number of adults in the country
- To determine the number of adults in the country paying their taxes to the federal government
- To determine the percent of adults in the country who believe the federal government wastes 51 cents or more of every dollar
- To determine the number of adults in the country who believe the federal government wastes tax dollars
(b) What is the population?
- Adults in the world aged 18 years or older
- Adults in the country aged 18 years or older
- The country’s federal government
- The 1088 adults in the country that were surveyed
(c) What is the sample?
- The country’s federal government
- The 1088 adults in the country that were surveyed
- Adults in the world aged 18 years or older
- Adults in the country aged 18 years or older
(d) List the descriptive statistics. Choose the correct answer below.
- There is a 90% chance surveying 1088 individuals from this country will result in a response that matches how the entire country would respond.
- The federal government wastes 51 cents or more of every dollar they receive.
- 37% of all adults 18 years or older in this country believe that 51 cents or more is wasted.
- 37% of the individuals surveyed indicated that 51 cents or more is wasted.
(e) What can be inferred from this survey?
- There is a 90% chance the federal government wastes 51 cents or more of every dollar received.
- The news service is 90% confident that the percentage of all adults in the country who believe the federal government wastes 51 cents or more of every dollar received is 37%.
- The news service is 90% confident that 37% of all adults believe that the federal government wastes 51 cents or more of every dollar recieved.
- The news service is 90% confident that the percentage of all adults in the country who believe the federal government wastes 51 cents or more of every dollar received is between 33% and 41%.
What is the level of measurement of the variable ”ISBN group identifier” in the original scenario?
- Nominal
- Ratio
- Ordinal
- Interval
Does the level of measurement of the variable change in the second scenario? Select the correct choice below and, if necessary, fill in the answer box within your choice.
- Yes, it changes to ____
- No, it stays the same.
Choose the correct answer below.
- Saying “data vary” means that the values of the variable change every time they are observed. Because data vary, each statistical analysis of a given variable will lead to different results.
- Saying “data vary” means that examining different types of subjects will yield different data, such as examining a person and examining a car. Because data vary, it is impossible to compare different types of subjects, such as comparing people and cars.
- Saying “data vary” means that the values of the variable change from individual to individual. In addition, certain variables can change over time for certain individuals. Because data vary, two different statistical analysis of the same variable can lead to different results.
- Saying “data vary” means that observations can be measured with fractions or decimals instead of only integers. Because data vary, it is important to make sure to accurately account for fractional observations.
15. Drag each phrase given above into the appropriate definition below.
The values of the variable name, label, or categorize. In addition, the naming scheme does not allow for the values of the variable to be arranged in a ranked or specific order.
The values of the variable name, label, or categorize. In addition, the naming scheme allows for the values of the variable to be arranged in a ranked or specific order.
Allows for the values of the variable to be arranged in a ranked or specific order. Differences in the values of the variable have meaning, but a value of zero does not mean the absence of the quantity. Arithmetic operations such as addition and subtraction can be performed on the values of the variable.
Allows for the values of the variable to be arranged in a ranked or specific order. Ratios of the values of the variable have meaning and a value of zero means the absence of the quantity. Arithmetic operations such as multiplication and division can be performed on the values of the variable.
16. __________ statistics consists of organizing and summarizing information collected, while ______ statistics uses methods that generalize results obtained from a sample to the population and measure the reliability of the results.
17. A(n) _______ is a numerical summary of a sample.
A(n) ________ is a numerical summary of a population.
18. Choose the correct answer below.
________ are the characteristics of the individuals of the population being studied.
19. Define Statistics
Choose the correct answer below.
- Statistics encompasses all scientific disciplines in which percentages are used, data are analyzed, and probabilities are found. In addition, statistics references any mathematical model which is reported using percentages or proportions.
- Statistics is the science of manipulating, reorganizing, and editing information to produce the desired results. In addition, statistics is about providing the required answer with the desired level of confidence.
- Statistics is the science of collecting, organizing, summarizing, and analyzing information to draw a conclusion and answer questions. In addition, statistics is about providing a measure of confidence in any conclusions.
- Statistics encompasses all scientific disciplines in which random occurrences are analyzed. In addition, statistics references any random occurrence which is reported using percentages or proportions.
20. Match each word or phrase with its definition.
Drag each word or phrase given above into the appropriate definition below.
Occurs when the effects of two or more explanatory variables are not separated. Therefore, any relation that may exist between an explanatory variable and the response variable may be due to some other variable not accounted for in the study.
An explanatory variable that was considered in a study whose effect cannot be distinguished from a second explanatory variable in the study.
A researcher randomly assigns the individuals in a study to groups, intentionally manipulated the value of an explanatory variable, controls other explanatory variables at fixed values, and then records the value of the response variable for each individual.
An explanatory variable that was not considered in a study, but that affects the value of the response variable in the study. In addition, this variable is typically related to other explanatory variables in the study.
A researcher measures the value of the response variable without attempting to influence the value of either the response or explanatory variables. That is, the researcher observes the behavior of individuals in the study and records the values of the explanatory and response variables.
21. Match each type of study to its definition.
Drag each type of study given above into the appropriate definition below.
Studies that are retrospecitve, meaning they require the researcher to look at existing records, or the subject to recall information from the past. Individuals who have certain characteristics are matched with those who don’t.
Studies that follow a group of individuals over a long period of time. Characteristics of the individuals are recorded and some individuals will be exposed to certain factors (not intentionally) and others will not. Because the data are collected over time, these studies are prospective.
Studies that collect information about individuals at a specific point in time, or over a short period of time.
22. What does it mean when an observational study is retrospective?
- A retrospective study collects the data over time.
- A retrospective study requires that individuals look back in time or require the researcher to look at existing records.
- A retrospective study is a list of all individuals in a population along with certain characteristics of each individual.
What does it mean when an observational study is prospective?
- A prospective study requires that individuals look back in time or require the researcher to look at existing records.
- A prospective study collects the data over time.
- A prospective study is a list of all individuals in a population along with certain characteristics of each individual.
23. Determine whether the study depicts an observational study or an experiment. A study is conducted to determine if there is a relationship between stomach cancer and alcohol consumption. Everyone treated at a hospital for stomach cancer was asked about their alcohol consumption
Does the description correspond to an observational study or an experiment?
- The study is an observational study because the researchers control one variable to determine the effect on the response variable.
- The study is an experiment because the researchers control one variable to determine the effect on the response variable.
- The study is an experiment because the study examines individuals in a sample, but does not try to influence the variable of interest.
- The study is an observational study because the study examines individuals in a sample, but does not try to influence the response variable.
24. Researchers wanted to determine if there was an association between daily coffee consumption and the occurrence of high cholesterol. The researchers looked at 94,389 women and asked them to report their coffee-drinking habits. The researchers also determined which of the women had high cholesterol. After their analysis, the researchers concluded that consumption of six or more cups of caffeinated coffee per day was associated with a reduction in high cholesterol. Complete parts (a) through (c) below.
(a) What type of observational study was this? Explain.
- This was a case-control study because individuals that had a certain characteristic were matched with those that did not.
- This was a cohort study because it identified a group of individuals to participate in the study and observed the group over a long period of time.
- This was a cross-sectional study because all information about the individuals was collected at a specific point in time.
(b) What is the response variable in the study? Is the response variable qualitative or quantitative? What is the explanatory variable?
What is the response variable in the study? Is the response variable qualitative or quantitative?
- The response variable is whether the woman has high cholesterol or not. The response variable is qualitative.
- The response variable is the number of individuals who participate in the study. The response variable is quantitative.
- The response variable is the number of individuals who participate in the study who drink six or more cups of caffeinated coffee per day. The response variable is quantitative.
- The response variable is consumption of caffeinated coffee. The response variable is quantitative.
What is the explanatory variable?
- The explanatory variable is the number of individuals who participate in the study who drink six or more cups of caffeinated coffee per day.
- The explanatory variable is whether the woman has high cholesterol or not.
- The explanatory variable is consumption of caffeinated coffee.
- The explanatory variable is the number of individuals who participate in the study.
(c) In their report, the researchers stated that “After adjusting for various demographic and lifestyle variables, daily consumption of six or more cups was associated with a 30% reduced prevalence of high cholesterol.”
Why was it important to adjust for these variables?
- The researchers were sure that various demographic and lifestyle variables had greater influence than daily consumption of six or more cups.
- The researchers wanted to ensure that the study was representative of the entire population, so they were likely to adjust the responses to match actual data collected for the entire population.
- The researchers may be concerned with confounding that occurs when the effects of two or more explanatory variables are not separated or when there are some explanatory variables that were not considered in a study, but that affect the value of the response variable.
- The researchers wanted to ensure that the sample was large enough in order to perform inference.
25. A web page design firm has two designs for an online hardware store. To determine which is the more effective design, the firm uses one page in the Atlanta area and a second page in the Oakland area.For each visit, the firm records the amount spent by the visitor and the number of items viewed.
Complete parts (a) through (c) below.
(a) What is the explanatory variable in this study? Is it qualitative or quantitative?
- The explanatory variable is the number of items viewed. This explanatory variable is quantitative.
- The explanatory variable is the location. This explanatory variable is qualitative.
- The explanatory variable is the web page design. The explanatory variable is qualitative.
- The explanatory variable is the amount spent by the visitor. This explanatory variable is quantitative.
(b) What are the two response variables? For each response variable, state whether it is qualitative or quantitative. Select all that apply.
- One response variable is the number of items viewed. This response variable is quantitative.
- One response variable is the web page design. This response variable is qualitative.
- One response variable is the amount spent by the visitor. This response variable is quantitative.
- One response variable is the location. This response variable is qualitative.
(c) Explain how confounding might be an issue with this study. Choose the correct answer below.
- Since the designs are being tested with two different locations, preferences depending on the location may affect the response variables for those groups.
- Since there are two response variables in this study, they may interact, causing the results to be misleading or incorrect.
- Since the variables are not all quantitative or all qualitative, they may interact, causing the results to be misleading or incorrect.
- Since there is only one explanatory variable, and two response variables, the explanatory variable will not affect both response variables equally, resulting in misleading results.
26. Researchers wanted to know if there is a link between proximity to high-tension wires and the rate of leukemia in children. To conduct the study, researchers compared the rate of leukemia for children who lived within 1/2 mile of high-tension wires to the rate of leukemia for children who did not live within 1/2 mile of high-tension wires. The researchers found that the rate of leukemia for children near high-tension wires was higher than the rate for those not near high-tension wires. Can the researchers conclude that proximity with high-tension wires causes leukemia in children?
(This is a reading assessment question. Be certain of your answer because you only get one attempt on this question.)
- Yes, because this is an observational studies, which allow for statements of causality.
- Yes, because this is a designed experiment, which allow for statements of causality.
- No, because this is an observational study.
- No, because this is a designed experiment.
27. What is an observational study? What is a designed experiment? Which allows the researcher to claim causation between an explanatory variable and a response variable?
What is an observational study?
- An observational study measures the value of the response variable without attempting to influence the value of either the response or explanatory variables.
- An observational study is when a researcher assigns individuals to a certain group, intentionally changing the value of an explanatory variable, and then recording the value of the response variable for each group.
- An observational study is a list of all individuals in a population along with certain characteristics of each individual.
What is a designed experiment?
- A designed experiment is a list of all individuals in a population along with certain characteristics of each individual.
- A designed experiment is when a researcher assigns individuals to a certain group, intentionally changing the value of an explanatory variable, and then recording the value of the response variable for each group.
- A designed experiment measures the value of the response variable without attempting to influence the value of either the response or explanatory variables.
Which allows the researcher to claim causation between an explanatory variable and a response variable?
________ allows the researcher to claim causation between an explanatory variable and a response variable
28. Explain what is meant by confounding. What is a lurking variable? What is a confounding variable?
What is meant by confounding?
- Confounding in a study occurs when a single explanatory variable has a great effect on a response variable. This sometimes causes a misleading interpretation of the relationship between the two variables.
- Confounding in a study occurs when the effects of the explanatory variable are caused, in some part, by the effects of the response variable. When there is zero confounding in a study, the effects of the response variable are entirely caused by the effects of the explanatory variable.
- Confounding in a study occurs when there is little or no actual relationship between the explanatory and response variable other than random chance. This sometimes causes completely unrelated variables to appear to have a causal relationship, and can cause variables that have almost no relationship to have a very strong relationship.
- Confounding in a study occurs when the effects of two or more explanatory variables are not separated. Therefore, any relation that may exist between an explanatory variable and the response variable may be due to some other variable or variables not accounted for in the study.
What is a lurking variable?
- A lurking variable is an explanatory variable that was not considered in a study, but that affects the value of the response variable in the study. In addition, lurking variables are typically related to explanatory variables in the study.
- A lurking variable is a response variable that was not considered in a study, but is also affected by the casual relationship of the explanatory variables in the study. In addition, lurking variables are typically related to response variables in the study.
- A lurking variable is a quantitative variable that has an infinite number of possible values that are not countable. In addition, lurking variables are typically very large numbers that make them difficult, if not impossible, to include in a study.
- A lurking variable is a quantitative variable that has either a finite number of possible values or a countable number of possible values. In addition, lurking variables are typically equal to zero, or almost equal to zero.
What is a confounding variable?
- A confounding variable is an explanatory variable that was considered in a study whose effect cannot be distinguished from a second explanatory variable in the study.
- A confounding variable is a response variable that has an effect on the explanatory variable, but it cannot be accurately measured in the study.
- A confounding variable is the explanatory variable on which a study has been focused.
- A confounding variable is a response variable that was not considered in a study whose effect cannot be distinguished from a second explanatory variable in the study.
29. What is a cross-sectional study? What is a case-control study? Which is the superior observational study? Why?
What is a cross-sectional study? Choose the correct answer below.
- Cross-sectional studies first identify a group of individuals to participate in the study. These individuals are then observed over a period of time. Over this period of time, characteristics about the individual are recorded.
- Cross-sectional studies are a list of all individuals in a population along with certain characteristics of each individual.
- Cross-sectional studies are observational studies that are retrospective, meaning that they require individuals to look back in time or require the researcher to look at existing records.
- Cross-sectional studies are observational studies that collect information about individuals at a specific point in time or over a very short period of time.
What is a case-control study? Choose the correct answer below.
- Case-control studies are a list of all individuals in a population along with certain characteristics of each individual.
- Case-control studies are observational studies that are retrospective, meaning that they require individuals to look back in time or require the researcher to look at existing records.
- Case-control studies are observational studies that collect information about individuals at a specific point in time or over a very short period of time.
- Case-control studies first identify a group of individuals to participate in the study. These individuals are then observed over a period of time. Over this period of time, characteristics about the individual are recorded.
Which is the superior observational study? Why? Choose the correct answer below.
- Case-control studies are always the superior observational study because they are relatively inexpensive to conduct and can be done relatively quickly.
- Cross-sectional studies are always the superior observational study because they are cheap and quick to do.
- Neither study is always the superior to the other. Both have advantages and disadvantages that depend on the situation.
30.