
Navigation » List of Schools, Subjects, and Courses » Math 120 – Introductory Probability and Statistics » Quizzes » Quiz 1
No Answers We dont have answer to this question yet. If you need help with your homework send us an email  or chat with our tutors
Quiz 1
Quiz 1
1. Determine whether the underlined value is a parameter or a statistic. In a national survey of high school students (grades 9 to 12), 25% of the students who responded reported that someone had offered, sold, or given them an illegal drug on school property. Is the value a parameter or a statistic?
- The value is a parameter because the respondents who were high school students (grades 9 to 12) are a population.
- The value is a parameter because the respondents who were high school students (grades 9 to 12) are a sample.
- The value is a statistic because the respondents who were high school students (grades 9 to 12) are a population.
- The value is a statistic because the respondents who were high school students (grades 9 to 12) are a sample.
2. Determine whether the variable is qualitative or quantitative. Amount of money spent on computers this year. Is the variable qualitative or quantitative?
- The variable is quantitative because it is a numerical measure.
- The variable is qualitative because it is a numerical measure.
- The variable is quantitative because it is an attribute characteristic.
- The variable is qualitative because it is an attribute characteristic.
–
3. Determine whether the quantitative variable is discrete or continuous. Percentage of a car’s surface which is rusted.
Is the variable discrete or continuous?
- The variable is discrete because it is not countable.
- The variable is continuous because it is not countable.
- The variable is discrete because it is countable.
- The variable is continuous because it is countable.
4. Determine the level of measurement of the variable below. Nation of origin
Choose the correct answer below.
- Interval
- Ordinal
- Nominal
- Ratio
5. A polling organization contacts 2047 undergraduates who attend a university and live in the United States and asks whether or not they had spent more than $200 on food in the last month. What is the population in the study?
- Undergraduates who attend a university and live in the United States and have spent more than $200 on food.
- Undergraduates who attend a university and have spent more than $200 on food.
- Undergraduates who attend a university.
- Undergraduates who attend a university and live in the United States.
What is the sample in the study?
- The 2047 undergraduates who attend a university and live in the United States.
- The 2047 undergraduates who attend a university and have spent more than $200 on food.
- Undergraduates who attend a university and live in the United States.
- Undergraduates who attend a university
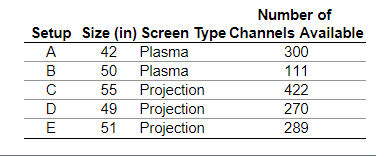
6. The data on the right relate to characteristics of high-definition televisions A through E. Identify the individuals, variables, and data corresponding to the variables. Determine whether each variable is qualitative, continuous, or discrete.
What are the individuals being studied?
- Televisions with screen sizes between 40 in and 60 in.
- Plasma and projection widescreen high-definition televisions.
- Television setups that include more than 100 channels.
- The high-definition television setups A through E.
What are the variables and their corresponding data being studied?
- Setup (A, B, C, D, E), size (42, 50, 55, 49, 51), screen type (Plasma, Plasma, Projection, Projection, Projection), and number of channels available (300, 111, 422, 270, 289)
- Size (42, 50, 55, 49, 51) and number of channels available (300, 111, 422, 270, 289)
- Size (42, 50, 55, 49, 51), screen type (Plasma, Plasma, Projection, Projection,projection), and number of channels available (300, 111, 422, 270, 289)
Determine whether each variable is qualitative, continuous, or discrete.
Size is a __________variable. Screen type is a ______variable. Number of channels available is a ______variable.
7. Determine whether the study depicts an observational study or an experiment. Forty patients with skin cancer are divided into two groups. One group receives an experimental drug to fight cancer, the other a placebo. After two years, the spread of the cancer is measured.
Does the description correspond to an observational study or an experiment?
- The study is an observational study because the researchers control one variable to determine the effect on the response variable.
- The study is an experiment because the researchers control one variable to determine the effect on the response variable.
- The study is an observational study because the study examines individuals in a sample, but does not try to influence the response variable.
- The study is an experiment because the study examines individuals in a sample, but does not try to influence the variable of interest.
8. What does it mean when an observational study is retrospective? What does it mean when an observational study is prospective? What does it mean when an observational study is retrospective?
- A retrospective study collects the data over time.
- A retrospective study requires that individuals look back in time or require the researcher to look at existing records.
- A retrospective study is a list of all individuals in a population along with certain characteristics of each individual.
What does it mean when an observational study is prospective?
- A prospective study requires that individuals look back in time or require the researcher to look at existing records.
- A prospective study collects the data over time.
- A prospective study is a list of all individuals in a population along with certain characteristics of each individual.
9. A web page design firm has two designs for an online hardware store. To determine which is the more effective design, the firm uses one page in the Dallas area and a second page in the Oakland area. For each visit, the firm records the number of items viewed and the amount of time visiting the site.Complete parts (a) through (c) below.
(a) What is the explanatory variable in this study? Is it qualitative or quantitative?
- The explanatory variable is the number of items viewed. This explanatory variable is quantitative.
- The explanatory variable is the amount of time visiting the site. This explanatory variable is quantitative.
- The explanatory variable is the location. This explanatory variable is qualitative.
- The explanatory variable is the web page design. The explanatory variable is qualitative.
(b) What are the two response variables? For each response variable, state whether it is qualitative or quantitative. Select all that apply.
- One response variable is the number of items viewed. This response variable is quantitative.
- One response variable is the location. This response variable is qualitative.
- One response variable is the web page design. This response variable is qualitative.
- One response variable is the amount of time visiting the site. This response variable is quantitative.
(c) Explain how confounding might be an issue with this study. Choose the correct answer below.
- Since there are two response variables in this study, they may interact, causing the results to be misleading or incorrect.
- Since the designs are being tested with two different locations, preferences depending on the location may affect the response variables for those groups.
- Since the variables are not all quantitative or all qualitative, they may interact, causing the results to be misleading or incorrect.
- Since there is only one explanatory variable, and two response variables, the explanatory variable will not affect both response variables equally, resulting in misleading results.
10. Define simple random sampling. Choose the correct answer below.
- Simple random sampling is the process of using chance to select individuals from a population to be included in the sample. The sample is then called a simple random sample.
- Simple random sampling is the process of obtaining a sample of size n from a population of the same size n. The sample is then called a simple random sample.
- A sample of size n from a population of size N is obtained through simple random sampling if every possible sample of size n has an equally likely chance of occurring. The sample is then called a simple random sample.
- Simple random sampling is the process of selecting individuals from a population using a convenient sample. The sample is then called a simple random sample.
11. What does it mean when sampling is done without replacement? Choose the correct answer below.
- Once a sample is taken, those individuals cannot be selected for any other samples.
- Once an individual is selected, the individual cannot be selected again.
- Once an individual is selected, the individual can be selected again.
- Once a sample is taken, those individuals are no longer considered part of the population.
12. A community college employs 86 full-time faculty members. To gain the faculty’s opinions about an upcoming building project, the college president wishes to obtain a simple random sample that will consist of 9 faculty members. He numbers the faculty from 1 to 86.
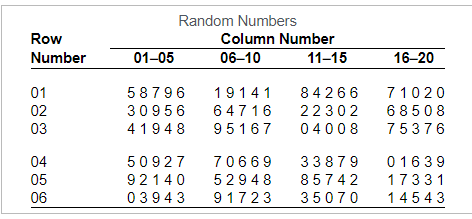
Complete parts (a) and (b) below.
(a) Using the provided random number table, the president closes his eyes and drops his ink pen on the table. It points to the digit in row 3, column 6. Using this position as the starting point and proceeding downward, determine the numbers for the 9 faculty members who will be included in the sample.
The numbers for the faculty members are
(b) The president uses technology to produce the following random numbers.
1 67 62 72 55 67 79 29 64 59
Determine the numbers for 9 faculty members who will be included in the sample.
The numbers for the faculty members are ____
13. To estimate the percentage of defects in a recent manufacturing batch, a quality control manager at Toyota selects every 17th car that comes off the assembly line starting with the fourth until she obtains a sample of 30 cars. What type of sampling is used?
- Systematic
- Cluster
- Convenience
- Simple random
- Stratified
14. To determine customer opinion of their inflight service, Continental Airlines randomly selects 70 flights during a certain week and surveys all passengers on the flights. What type of sampling is used?
- Simple random
- Stratified
- Cluster
- Systematic
- Convenience
15. A professor wants to randomly select 4 students to go to the board. She decides to randomly select the seventh student who enters the classroom and every eighth student after that. Determine the students who will be going to the board. Write down the student numbers.
The numbers of the students that will be going to the board are
16. Determine whether the following statement is true or false. Explain. When conducting a cluster sample, it is better to have fewer clusters with more individuals when the clusters are heterogeneous.
Choose the correct answer below.
- True, because when the clusters are heterogeneous, they are scaled down versions of the population.
- False. It is better to have fewer clusters when the clusters are homogeneous.
- False, because the proportion of individuals per cluster to the population should not be affected by whether or not the clusters are heterogeneous.
- True, because heterogeneous clusters are not likely to resemble population heterogeneity, increasing the number of necessary individuals.
17. Determine whether the following statement is true or false. Explain. When obtaining a stratified sample, the number of individuals included within each stratum must be equal. Choose the correct answer below.
- False. Within stratified samples, the number of individuals sampled from each stratum should be proportional to the size of the strata in the population.
- False. When taking a stratified sample, a simple random sample is drawn from one stratum at random. All other strata will not be included in the sample.
- False. A stratified sample is constructed by successively selecting a stratum at random and then selecting a random individual from within that stratum. With this process, it is unlikely that all strata will be sampled from the same number of times.
- True. Sampling the same number of people from each stratum will result in a sample that is representative of the population at a lower cost than a simple random sample.
or chat with our tutors