
Navigation » List of Schools, Subjects, and Courses » Math 138 – Statistics » Quizzes » Quiz 2
No Answers We dont have answer to this question yet. If you need help with your homework send us an email  or chat with our tutors
Quiz 2
Quiz 2
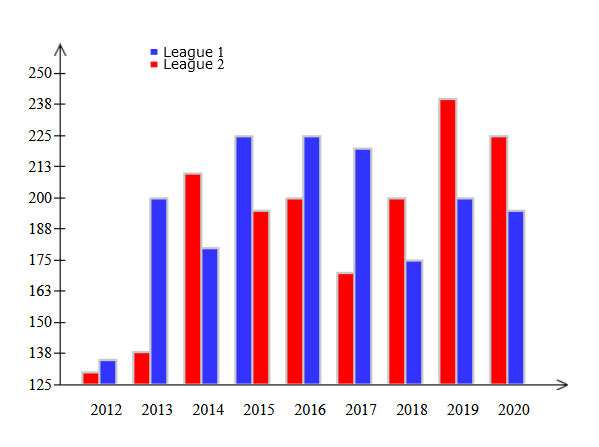
1. Music sales: The following frequency distribution presents the sales, in millions of dollars, for several categories of music during two different years.
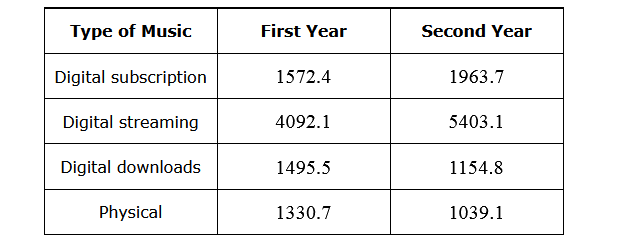
Digital streaming _______from the first year to the second.
2. Select the appropriate word or phrase to complete each sentence.
In a data set, the proportion of items that are in a particular category is called the ___________
3. Hospital admissions: The following frequency distribution presents the five most frequent reasons for hospital admissions in U.S. community hospitals in a recent year.
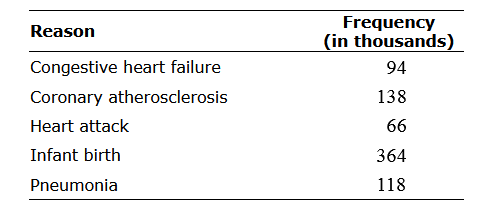
The categories coronary atherosclerosis, congestive heart failure, and heart attack refer to diseases of the circulatory system. True or false: There were less hospital admissions for infant birth than for diseases of the circulatory system.
It is ____ that there were less hospital admissions for infant birth than for diseases of the circulatory system.
4.
Select the appropriate word or phrase to complete each sentence.
A histogram is _____if it has two clearly distinct modes.
5.
Select the appropriate word or phrase to complete each sentence.
_________ is useful when the data consist of values measured at different points in time.
6. List the data in the following stem-and-leaf plot. The leaf represents the tenths digit.
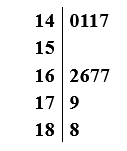
Separate the numbers in the list by a comma. The list is:
 or chat with our tutors