
Navigation » List of Schools, Subjects, and Courses » Math 138 – Statistics » Homeworks » 2.1 Homework
No Answers We dont have answer to this question yet. If you need help with your homework send us an email  or chat with our tutors
2.1 Homework
2.1 Homework
1. Select the appropriate word or phrase to complete each sentence.
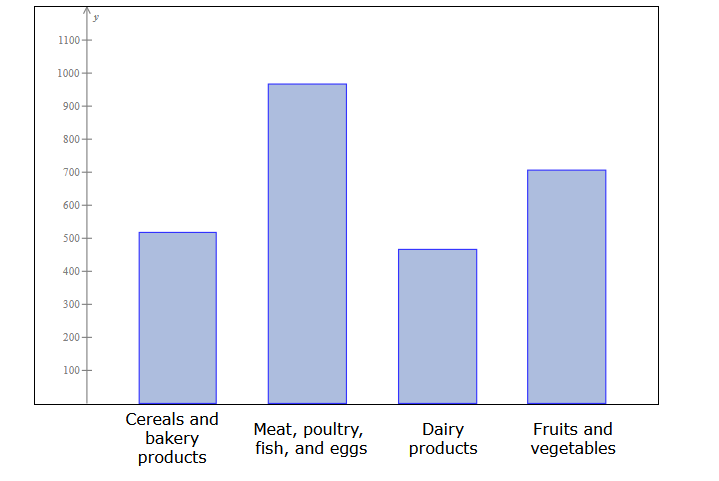
On which food category was the most money spent?
True or false: On the average, families spent more on fruits and vegetables than on cereals and bakery products.
- True
- False
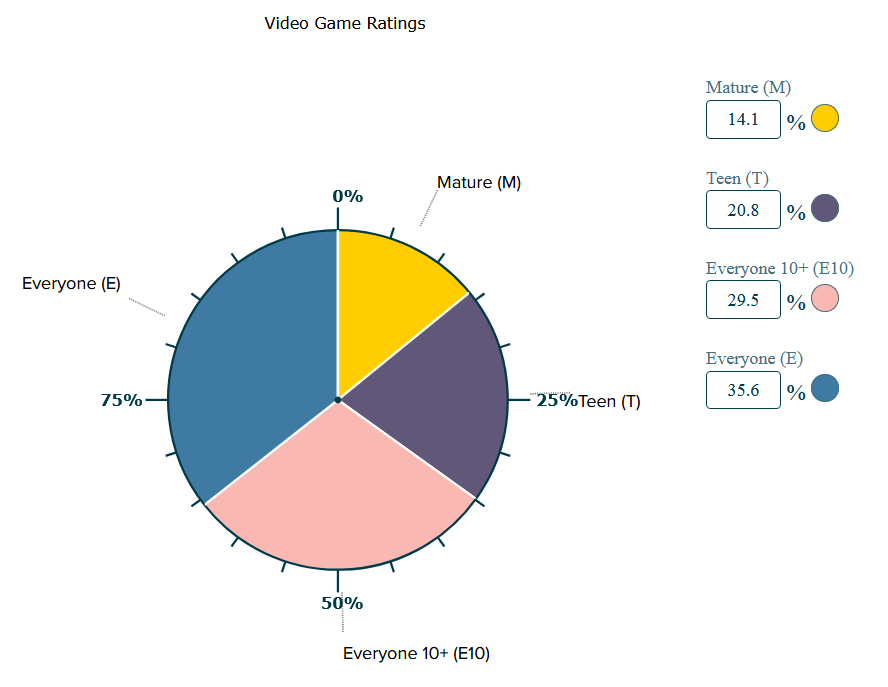
(b) In which rating category are the least games sold? ____ is the rating category with the least games sold.
(c) True or false: More than twice as many E10-rated games are sold as T-rated games.
(d) True or false: Greater than one in three games sold is an M-rated game.
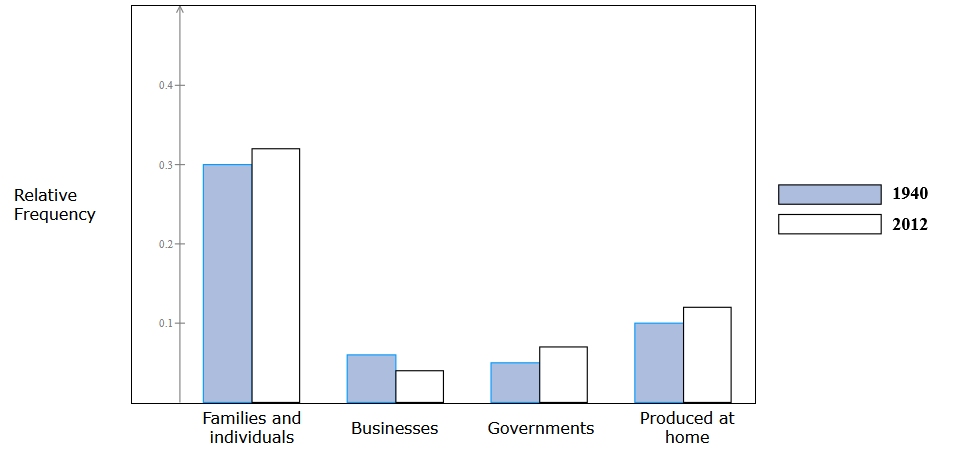
1940, the smallest source of funds for food expenditures was Governments. Is this the smallest source of funds in 2012?
2012 is ______
1940, the largest source of funds for food expenditures was Families and individuals. Is this the largest source of funds in
2012?
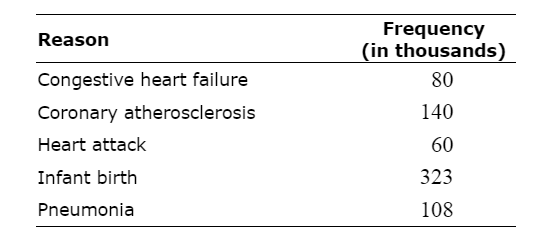
(a)Construct a frequency bar graph.
(b)The categories coronary atherosclerosis, congestive heart failure, and heart attack refer to diseases of the circulatory system. True or false: There were less hospital admissions for infant birth than for diseases of the circulatory system.
It is _______ that there were less hospital admissions for infant birth than for diseases of the circulatory system.
7. Hospital admissions: The following frequency distribution presents the five most frequent reasons for hospital admissions in U.S. community hospitals in a recent year.
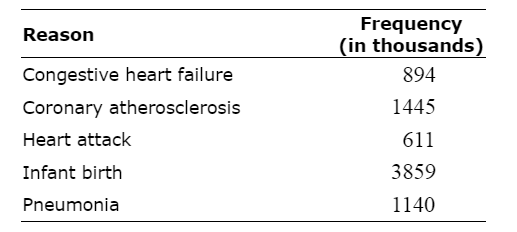
(a) Construct a relative frequency distribution. Round the answers to two decimal places.
(b) Construct a relative frequency bar graph.
(c) Construct a pie chart.
or chat with our tutors