
Navigation » List of Schools, Subjects, and Courses » Math 1140 – Introduction to Statistics » Homeworks » Chapter 3 Homework
No Answers We dont have answer to this question yet. If you need help with your homework send us an email  or chat with our tutors
Chapter 3 Homework
Chapter 3 Homework
1. Find the (a) mean, (b) median, (c) mode, and (d) midrange for the data and then (e) answer the given question.
Listed below are foot lengths in inches of randomly selected women in a study of a country’s military in 1988. Are the statistics representative of the current population of all women in that country’s military?
9.5 9.2 10.1 9.2 9.0 9.7 9.3 9.9 8.7 10.1 10.1
Find the mean. The mean is ___ inch(es). (Type an integer or a decimal rounded to two decimal places as needed.)
Find the median. The median is ___ inch(es). (Type an integer or a decimal. Do not round.)
Find the mode. Select the correct choice below and, if necessary, fill in the answer box to complete your choice.
- The mode(s) is(are) ___ inches (Type an integer or a decimal. Do not round. Use a comma to separate answers as needed.)
- There is no mode.
Find the midrange. The midrange is ____ inches. (Type an integer or a decimal. Do not round.)
Are the statistics representative of the current population of all women in that country’s military? Choose the best answer below.
- Since the sample does not include men, the sample should not be considered to be representative of the population.
- Since the sample is random and the sample size is greater than 10, the sample can be considered to be representative of the population.
- Since the measurements were made in 1988, they are not necessarily representative of the current population of all women in the country’s military.
- Since the sample is not a random sample, it should not be considered to be representative of the population.
2. Listed below are the annual tuition amounts of the 10 most expensive colleges in a country for a recent year. What does this “Top 10” list tell us about the population of all of that country’s college tuitions?
$ 53,735 $ 53,640 $ 51,324 $ 51,324 $ 53,061 $ 52,084 $ 52,505 $ 52,579 $ 53,323 $ 51,949
Find the mean, midrange, median, and mode of the data set.
The mean of the data set is _____ (Round to two decimal places as needed.)
The midrange of the data set is ___. (Round to two decimal places as needed.)
The median of the data set is _____. (Round to two decimal places as needed.)
What is (are) the mode(s) of the data set?
Select the correct choice below and, if necessary, fill in the answer box within your choice.
- The mode(s) of the data set is (are) ____.(Use a comma to separate answers as needed. Round to two decimal places as needed.)
- There is no mode.
What does this “Top 10” list tell us about the population of all the country’s college tuitions?
- All colleges have tuitions around the mode.
- All colleges have tuitions around the mean.
- All colleges have tuitions around the midrange.
- All colleges have tuitions around the median.
- Nothing meaningful can be concluded from this information except that these are the largest tuitions of colleges in the country for a recent year.
3. Listed below are pulse rates (beats per minute) from samples of adult males and females. Find the mean and median for each of the two samples and then compare the two sets of results. Does there appear to be a difference?
Find the means. The mean for males is ___ beats per minute and the mean for females is ___ beats per minute. (Type integers or decimals rounded to one decimal place as needed.)
Find the medians. The median for males is ___ beats per minute and the median for females is ___ beats per minute. (Type integers or decimals rounded to one decimal place as needed.)
Compare the results. Choose the correct answer below.
- The mean and the median for males are both lower than the mean and the median for females.
- The mean and the median for females are both lower than the mean and the median for males.
- The median is lower for males, but the mean is lower for females.
- The mean is lower for males, but the median is lower for females.
- The mean and median appear to be roughly the same for both genders.
Does there appear to be a difference?
- Since the sample size is small, no meaningful information can be gained from analyzing the data.
- The pulse rates for females appear to be higher than the pulse rates for males.
- The pulse rates for males appear to be higher than the pulse rates for females.
- There does not appear to be any difference.
4. One common system for computing a grade point average (GPA) assigns 4 points to an A, 3 points to a B, 2 points to a C, 1 point to a D, and 0 points to an F. What is the GPA of a student who gets an A in a 3-credit course, a B in each of three 4-credit courses, a C in a 2-credit course, and a D in a 3-credit course?
The mean grade point score is ____ (Round to the nearest tenth as needed.)
5. A student’s course grade is based on one midterm that counts as 5% of his final grade, one class project that counts as 20% of his final grade, a set of homework assignments that counts as 50% of his final grade, and a final exam that counts as 25% of his final grade. His midterm score is 63, his project score is 96, his homework score is 95, and his final exam score is 79. What is his overall final score? What letter grade did he earn (A, B, C, D, or F)? Assume that a mean of 90 or above is an A, a mean of at least 80 but less than 90 is a B, and so on.
His overall final score is ____ (Type an integer or a decimal rounded to one decimal place as needed.)
His letter grade is ___
6. Which of the following is NOT a measure of center? Choose the correct answer below.
- mode
- Mean
- median
- census
7. Fill in the blank.
The measure of center that is the value that occurs with the greatest frequency is the _______.
The variance of the sample data is _____
9. Listed below are the top 10 annual salaries (in millions of dollars) of TV personalities. Find the range, variance, and standard deviation for the sample data. Given that these are the top 10 salaries, do we know anything about the variation of salaries of TV personalities in general?
39 37 35 28 19 15 13 10 9.6 9.0
The range of the sample data is _____ million. (Type an integer or a decimal.)
The variance of the sample data is ____. (Round to two decimal places as needed.)
The standard deviation of the sample data is _____ million. (Round to two decimal places as needed.)
Is the standard deviation of the sample a good estimate of the variation of salaries of TV personalities in general?
- No, because there is an outlier in the sample data.
- Yes, because the standard deviation is an unbiased estimator.
- Yes, because the sample is random.
- No, because the sample is not representative of the whole population.
10. Listed below are the amounts (dollars) it costs for marriage proposal packages at different baseball stadiums. Find the range, variance, and standard deviation for the given sample data. Include appropriate units in the results. Are there any outliers, and are they likely to have much of an effect on the measures of variation?
36 45 45 65 70 95 95 170 190 203 260 300 400 1750 2500
The range of the sample data is ____dollars. (Type an integer or a decimal. Do not round.)
The standard deviation of the sample data is ____ dollars. (Round to one decimal place as needed.)
The variance of the sample data is _____dollars squared .
(Round to one decimal place as needed.)
Are there any outliers and, if so, are they likely to have much of an effect on the measures of variation?
- Yes, the smallest amounts are much lower than the rest of the data, and appear to be outliers. It is not likely that these are having a large effect on the measures of variation.
- Yes, the largest amounts are much higher than the rest of the data, and appear to be outliers. It is not likely that these are having a large effect on the measures of variation.
- Yes, the largest amounts are much higher than the rest of the data, and appear to be outliers. It is likely that these are having a large effect on the measures of variation.
- No, there are not any outliers.
11. Use software or a calculator to find the range, variance, and standard deviation of the following body temperatures, in degrees Fahrenheit, taken at 12:00 A.M.
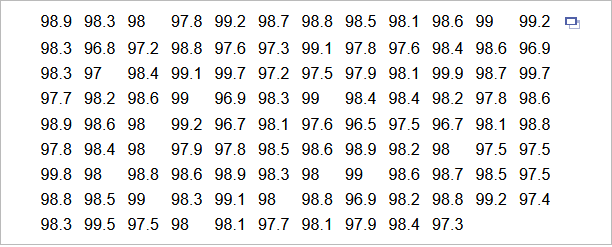
The range of the data set is ___ degrees F. (Round to two decimal places as needed.)
The standard deviation, s, of the data set is ____ degrees F. (Round to two decimal places as needed.)
The variance, s squared, of the data set is ____ (Round to two decimal places as needed.)
12 Identify the symbols used for each of the following: (a) sample standard deviation; (b) population standard deviation; (c) sample variance; (d) population variance.
- The symbol for sample standard deviation is ______
- The symbol for population standard deviation is ______
- The symbol for sample variance is ______
- The symbol for population variance is _____
13. Which measure of variation is most sensitive to extreme values? Choose the correct answer below.
- Range
- Median
- Mean
- Histogram
14 Which of the following is NOT a property of the standard deviation?Choose the correct answer below.
- The standard deviation is a measure of variation of all data values from the mean.
- The value of the standard deviation is never negative.
- The units of the standard deviation are the same as the units of the original data.
- When comparing variation in samples with very different means, it is good practice to compare the two sample standard deviations.
15. Fill in the blank. For data sets having a distribution that is approximately bell-shaped, _______ states that about 68% of all data values fall within one standard deviation from the mean.
16. Fill in the blank. The square of the standard deviation is called the _______.
17. A successful basketball player has a height of 6 feet 8inches, or 203cm. Based on statistics from a data set, his height converts to the z score of 4.10. How many standard deviations is his height above the mean?
The player’s height is ____ standard deviation(s) above the mean. (Round to two decimal places as needed.)
18. If your score on your next statistics test is converted to a z score, which of these z scores would you prefer: -2.00, -1.00, 0, 1.00, 2.00? Why?
- The z score of 0 is most preferable because it corresponds to a test score equal to the mean.
- The z score of 1.00 is most preferable because it is 1.00 standard deviation above the mean and would correspond to an above average test score.
- The z score of -1.00 is most preferable because it is 1.00 standard deviation below the mean and would correspond to an above average test score.
- The z score of 2.00 is most preferable because it is 2.00 standard deviations above the mean and would correspond to the highest of the five different possible test scores.
- The z score of -2.00 is most preferable because it is 2.00 standard deviations below the mean and would correspond to the highest of the five different possible test scores.
19. Researchers measured the data speeds for a particular smartphone carrier at 50 airports. The highest speed measured was 74.5Mbps. The complete list of 50 data speeds has a mean of x=18.35Mbps and a standard deviation of s=17.81Mbps.
- What is the difference between carrier’s highest data speed and the mean of all 50 data speeds?
- How many standard deviations is that [the difference found in part (a)]?
- Convert the carrier’s highest data speed to a z score.
- If we consider data speeds that convert to z scores between minus2 and 2 to be neither significantly low nor significantly high, is the carrier’s highest data speed significant?
- The difference is ___ Mbps. (Type an integer or a decimal. Do not round.)
- The difference is standard deviations. (Round to two decimal places as needed.)
- The z score is z=______ (Round to two decimal places as needed.)
- The carrier’s highest data speed is ___________
20. For a data set of the pulse rates for a sample of adult females, the lowest pulse rate is 37 beats per minute, the mean of the listed pulse rates is x=79.0 beats per minute, and their standard deviation is s=24.6beats per minute.
- What is the difference between the pulse rate of 37beats per minute and the mean pulse rate of the females?
- How many standard deviations is that [the difference found in part (a)]?
- Convert the pulse rate of 37beats per minutes to a z score.
- If we consider pulse rates that convert to z scores between minus2 and 2 to be neither significantly low nor significantly high, is the pulse rate of 37beats per minute significant?
- The difference is _____ beats per minute.
- The difference is ____ standard deviations. (Round to two decimal places as needed.)
- The z score is z=_____(Round to two decimal places as needed.)
- The lowest pulse rate is ________
21. Consider a value to be significantly low if its z score less than or equal to minus2 or consider a value to be significantly high if its z score is greater than or equal to 2. A test is used to assess readiness for college. In a recent year, the mean test score was 21.8and the standard deviation was 5.1. Identify the test scores that are significantly low or significantly high.
What test scores are significantly low? Select the correct answer below and fill in the answer box(es) to complete your choice.
- Test scores that are less than ____ (Round to one decimal place as needed.)
- Test scores that are between ____ and ______(Round to one decimal place as needed. Use ascending order.)
- Test scores that are greater than _____(Round to one decimal place as needed.)
What test scores are significantly high? Select the correct answer below and fill in the answer box(es) to complete your choice.
- Test scores that are between _____ and ____(Round to one decimal place as needed. Use ascending order.)
- Test scores that are less than ______ (Round to one decimal place as needed.)
- Test scores that are greater than ______ (Round to one decimal place as needed.)
22. Use z scores to compare the given values. The tallest living man at one time had a height of 226cm. The shortest living man at that time had a height of 143.9cm. Heights of men at that time had a mean of 177.78cm and a standard deviation of 5.35cm. Which of these two men had the height that was more extreme?
Since the z score for the tallest man is z= _____ and the z score for the shortest man is z=_____, the _______ man had the height that was more extreme.
23. Use z scores to compare the given values. Based on sample data, newborn males have weights with a mean of 3259.4g and a standard deviation of 582.9g. Newborn females have weights with a mean of 3026.6g and a standard deviation of 700.5. Who has the weight that is more extreme relative to the group from which they came: a male who weighs 1600g or a female who weighs 1600g?
Since the z score for the male is z= ______ and the z score for the female is _____, the _____ has the weight that is more extreme.
24. Use z scores to compare the given values. In a recent awards ceremony, the age of the winner for best actor was 32and the age of the winner for best actress was 46. For all best actors, the mean age is 45.9 years and the standard deviation is 6.9 years. For all best actresses, the mean age is 32.9years and the standard deviation is 12.1years. (All ages are determined at the time of the awards ceremony.) Relative to their genders, who had the more extreme age when winning the award, the actor or the actress? Explain.
Since the z score for the actor is z=____ and the z score for the actress is z=_____, the ____ had the more extreme age.
25. Fill in the blank. When a data value is converted to a standardized scale representing the number of standard deviations the data value lies from the mean, we call the new value a _______.
26. Fill in the blank. A data value is considered _______ if its z-score is less than ____or greater than 2.
27. Fill in the blank. Whenever a data value is less than the mean, _______.
28. The boxplot shown below results from the heights (cm) of males listed in a data set. What do the numbers in that boxplot tell us?
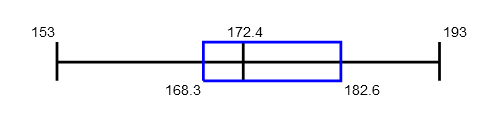
The minimum height is ____ cm, the first quartile Q1 is _____ cm, the second quartile Q2 (or the median) is _____ cm, the third quartile Q3is _____cm, and the maximum height is ___ cm
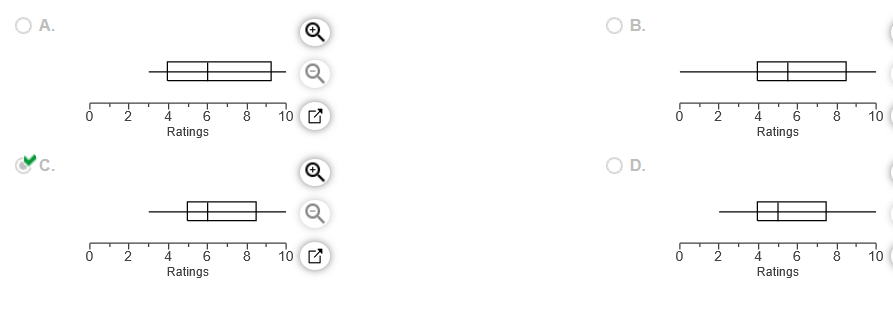
29. The following are the ratings of males by females in an experiment involving speed dating. Use the given data to construct a boxplot and identify the 5-number summary.
![]()
The 5-number summary is _____________(Use ascending order. Type integers or decimals. Do not round.)
Which boxplot below represents the data?
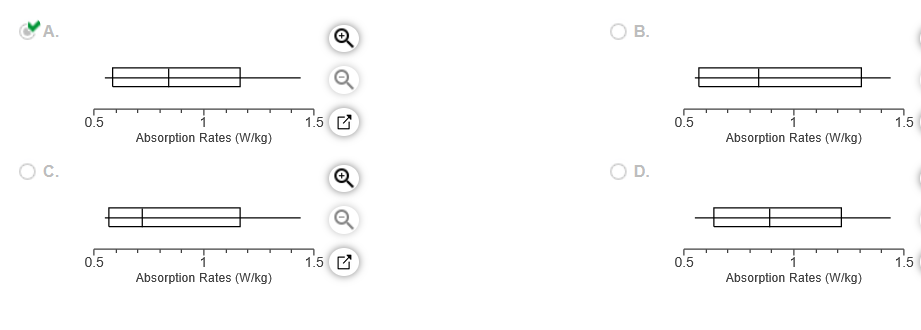
30. Listed below are the measured radiation absorption rates (in W/kg) corresponding to 11 cell phones. Use the given data to construct a boxplot and identify the 5-number summary.
![]()
The 5-number summary is _________all in W/kg. (Use ascending order. Type integers or decimals. Do not round.)
Which boxplot below represents the data?
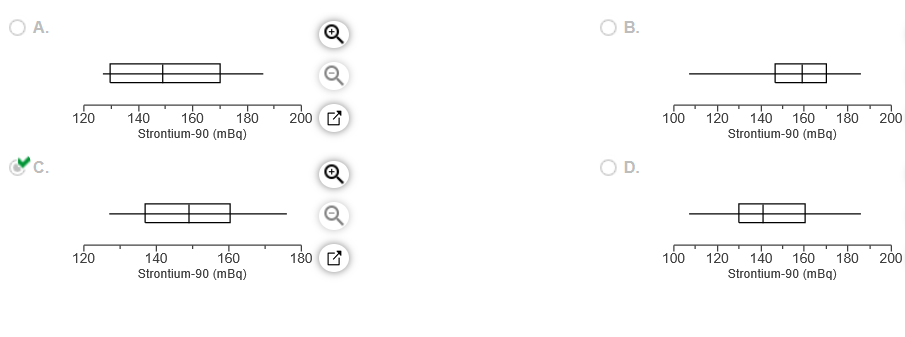
31. Listed below are amounts of strontium-90 (in millibecquerels, or mBq) in a simple random sample of baby teeth obtained from residents in a region born after 1979. Use the given data to construct a boxplot and identify the 5-number summary.

The 5-number summary is ______ all in mBq.
(Use ascending order. Type integers or decimals. Do not round.)
Which boxplot below represents the data?
32. Fill in the blank.
In modified boxplots, a data value is a(n) _______ if it is above Q3 + (1.5)(IQR) or below Q1 – (1.5)(IQR).
33. Which of the following is NOT a value in the 5-number summary? Choose the correct answer below.
- Q1
- Mean
- Median
- Minimum
or chat with our tutors