
Navigation » List of Schools, Subjects, and Courses » Math 2210 – Statistics » Exams » Exam 1
No Answers We dont have answer to this question yet. If you need help with your homework send us an email  or chat with our tutors
Exam 1
Exam 1
1. Prior to graduation, a high-school class was surveyed about their plans. The table to the right displays the results for white and minority students. Complete parts a) through e) below.
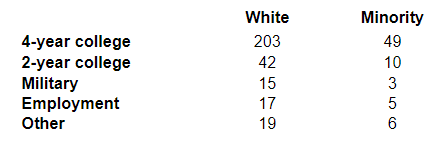
a) What percent of the graduates are white?
b) What percent of the graduates are planning to attend a 2-year college?
c) What percent of the graduates are white and planning to attend a 2-year college?
d) What percent of the white graduates are planning to attend a 2-year college?
e) What percent of the graduates planning to attend a 2-year college are white?
2. Identify the W’s, name the variables, specify for each variable whether its use indicates that it should be treated as categorical or quantitative, and, for any quantitative variable, identify the units in which it was measured.
In performing research for an ecology class, students at a college in upstate New York collect data on streams each year. They record a number of biological, chemical, and physical variables, including the stream name, the substrate of the stream (limestone, shale, or mixed), the acidity of the water (pH), the temperature (°C), and the BCI (a numerical measure of biological diversity).
Identify the Who in this situation. Choose the correct answer below.
- The college
- The biological organisms that contribute to the BCI
- The streams
- The students
- The Who is not specified.
Identify the What in this situation. Select all that apply.
- Name of stream
- Substrate of the stream
- Temperature
- Acidity of the water
- BCI
- The What is not specified.
Identify the When in this situation. Choose the correct answer below.
- One day in December and one day in May
- One week in November and one week in April
- Over the course of the entire semester
- The first day of class
- The When is not specified.
Identify the Where in this situation. Choose the correct answer below.
- The classroom
- Upstate New York
- The college’s athletic center pool
- The Where is not specified.
- Identify the Why in this situation. Choose the correct answer below.
- To reduce the acidity of New York’s streams
- To increase biological diversity
- To mine for precious stones
- The Why is not specified.
Identify the How in this situation. Select all that apply.
- Gathering sample water from each stream and studying it back at the campus
- Mixing several different stream waters together and watching for a reaction
- Swimming in the streams
- The How is not specified.
3. The data below give the number of hurricanes that happened over a 14 year period.

Which of the following is the correct dotplot for the given data?
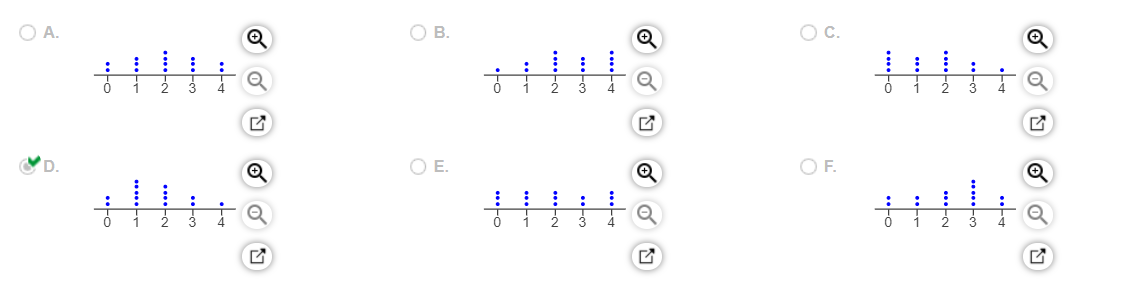
Is the distribution uniform, unimodal, or bimodal?
- The distribution is unimodal.
- The distribution is bimodal.
- The distribution is uniform.
Is the distribution symmetric or skewed?
- The distribution is skewed to the right.
- The distribution is symmetric.
- The distribution is skewed to the left.
Which of the following best describes the center of the data?
- The center is best described by the mean, which is 1.5.
- The center is best described by the mean, which is approximately 1.6.
- The center is best described by the median, which is 1.5.
- The center is best described by the median, which is approximately 1.6.
The spread of the data is ______ to ____________ hurricanes. (Type a whole number. Use ascending order.)
Describe any unusual features.
- As the years progressed the number of hurricanes increased.
- As the years progressed the number of hurricanes decreased.
- The number of hurricanes is cyclic over the years.
- There are no unusual features.
4. For the following description of data, identify the W’s from what’s given, name the variables, specify for each variable whether its use indicates that it should be treated as categorical or quantitative, and, for any quantitative variable, identify the units in which it was measured (or note that they were not provided).
In a study appearing in a science journal, a research team reports that plants in southern England are flowering earlier in the spring. Records of the first flowering dates for 384 species over a period of 47 years show that flowering has advanced an average of 12 days per decade, an indication of climate warming, according to the authors.
Identify the Who.
- All plant species in southern England
- The first flowering dates for 384 plant species in southern England
- The Who for this situation cannot be determined from the given information.
- 384 plant species in southern England
- All flowering plants
Identify the What for the study.
- All plant species in southern England
- The first flowering dates for 384 plant species in southern England
- 384 plant species in southern England
- The first flowering dates for all plant species in southern England
- The What for this situation cannot be determined from the given information.
Identify the When.
- 12 days per decade over the past 47 years
- 47 years ago
- 47 years ago until today
- The When for this situation cannot be determined from the given information.
Identify the Where.
- The headquarters of the science journal
- The laboratory of the research team
- Southern England
- The Where for this situation cannot be determined from the given information.
Identify the Why.
- The study was conducted in order count the number of species of plants in southern England.
- The study was conducted in order prove that climate warming is real.
- The study was conducted to determine whether plants are flowering earlier in the spring.
- The study was conducted to determine if climate warming is real.
Identify the How.
- By monitoring the developmental cycle of 384 plant species over the first 12 days of spring per decade within the past 47 years
- By monitoring the growth rate of the 384 plant species year over year for the past 47 years
- By measuring the first flowering date of 384 individual plants year over year for the past 47 years
- The How for this situation cannot be determined from the given information.
Identify the type of each variable.
The first flowering date variable is _____________
The year variable is ______________
The flower species variable is ___________
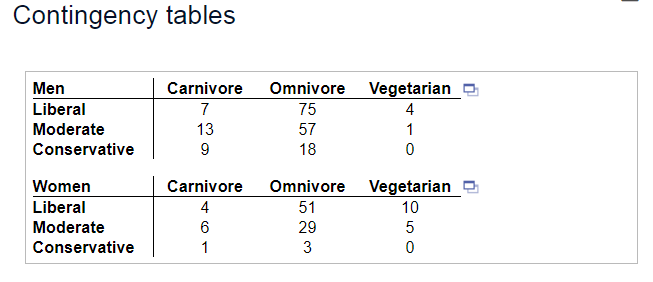
5. A survey asked 293 undergraduate students about diet preference (Carnivore, Omnivore, Vegetarian) and political alignment (Liberal, Moderate, Conservative). Two contingency tables are given.
a) Are women or men more likely to be conservative carnivores?
b) Are liberal vegetarians more likely to be women or men?
-
____________________ are more likely to be conservative carnivores because _______ of women and _______ of men in the survey are conservative carnivores. (Round to one decimal place as needed.)
-
Liberal vegetarians are more likely to be _______ because of the liberal vegetarians in the survey are women and _________ are men. (Round to one decimal place as needed.)
6. Fuel economy estimates for automobiles built one year predicted a mean of 29.2 mpg and a standard deviation of 4.8 mpg for highway driving. Assume that a Normal model can be applied. Use the 68−95−99.7 Rule to complete parts a) through e).
A Draw the model for auto fuel economy
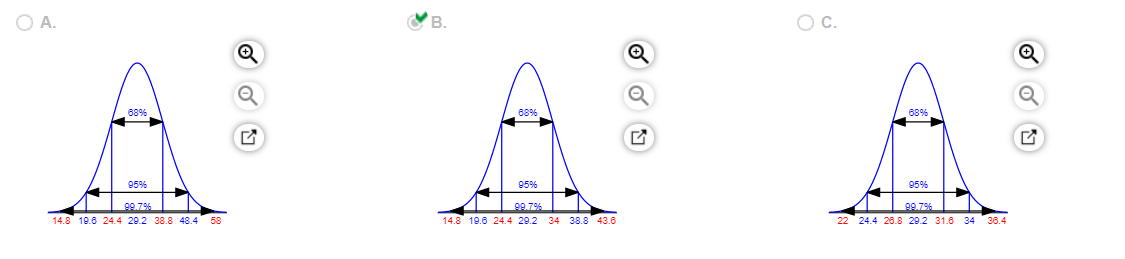
B. In what interval would you expect the central 99.7% of autos to be found?
Using the 68-95-99.7 rule, the central 99.7% of autos can be expected to be found in the interval from _________ to _________ mpg. (Do not round. Type integers or decimals.)
C. About what percent of autos should get more than 34 mpg?
Using the 68-95-99.7 rule, about _______________ of autos should get more than 34 mpg. (Do not round. Type an integer or a decimal.)
D. About what percent of autos should get between 34 and 38.8 mpg?
Using the 68-95-99.7 rule, about _____________ of autos should get between 34 and 38.8 mpg. (Do not round. Type an integer or a decimal.)
E. Describe the gas mileage of the worst 2.5% of cars
Choose the correct answer below.
- They get less than 24.4 mpg.
- They get more than 34 mpg.
- They get less than 14.8 mpg.
- They get less than 19.6 mpg.
7. An auctioneer sold a herd of cattle whose minimum weight was 1000 pounds, median was 1120 pounds, standard deviation 77, and IQR 102 pounds. They sold for 60 cents a pound, and the auctioneer took a $30 commission on each animal. Then, for example, a steer weighing 1100 pounds would net the owner 0.60(1100)−30=$630. Find the minimum, median, standard deviation, and IQR of the net sale prices.
The minimum price is _______
The median price is _______
The standard deviation of the prices is _______
The IQR of the prices is ____________
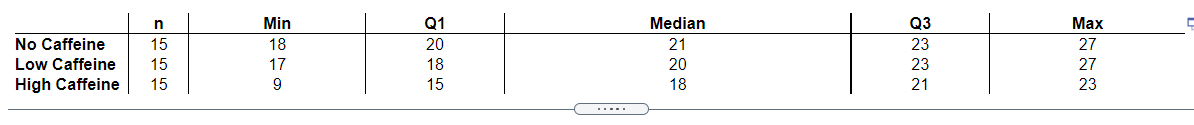
8. A student study of the effects of caffeine asked volunteers to take a memory test 2 hours after drinking soda. Some drank caffeine-free, some drank regular, and others drank a mixture of the two (getting a half-dose of caffeine). The 5-number summaries for each group’s scores (number of items recalled correctly) on the memory test are shown below. Complete parts a through d.
Describe the W’s for these data
Who
What
Where
When
How
Why
Name the variables and classify each as categorical or quantitative
The two variables are the ________ and the _______________ which are _______ and _______ variables respectively
Create side-by-side boxplots to display these results as best you can with this information
Create side-by-side boxplots, where N represents the group with no caffeine, L the group with low caffeine, and H the group with high caffeine. Choose the correct graph below
Write a few sentences comparing the performances of the three groups
The participants scored about the same with _____________.
The medians for these two groups were ________ with slightly more variation in ______________________
The __________________ generally scored lower than the other two groups on all measures of the 5-number summary.
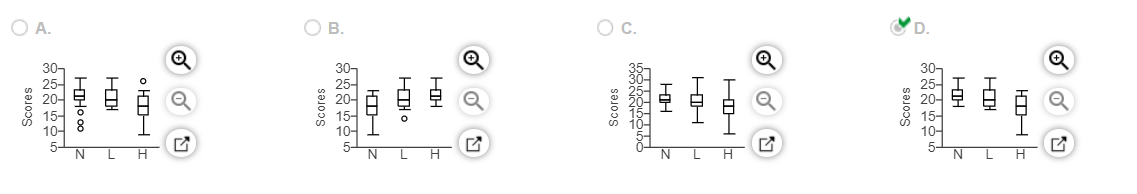
9. The pie chart shows the ratings assigned to first-run movies released in a recent year.
common rating?
a) Is this an appropriate display for these data? Explain.
- No, because each movie might fall into more than one category and the categories always overlap.
- Yes, because we are given a frequency table.
- Yes, because each movie falls into only one category and no categories overlap.
- No, because there are too many movies to be displayed in a pie chart.
b) Which was the least common rating? _____________
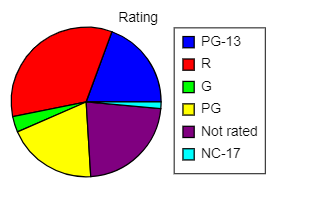
10. Shown to the right are the histogram and summary statistics for the number of camp sites at public parks in a particular state. Use this information to complete parts a through d below
a) Which statistics would you use to identify the center and spread of this distribution? Why?
Because the distribution is __________, the _________ should be used to describe the center and the ______should be used to describe the spread.
b.
- There are three outliers because three data values are either more than 1.5 IQRs below Q1 or more than 1.5 IQRs above Q3.
- There are two outliers because two data values are more than 3 standard deviations from the mean.
- There are no parks that would be classified as outliers.
- There are three outliers because three data values are more than 3 standard deviations from the mean.
- There are two outliers because two data values are either more than 1.5 IQRs below Q1 or more than 1.5 IQRs above Q3.
c) Create a boxplot for these data. Choose the correct boxplot below.
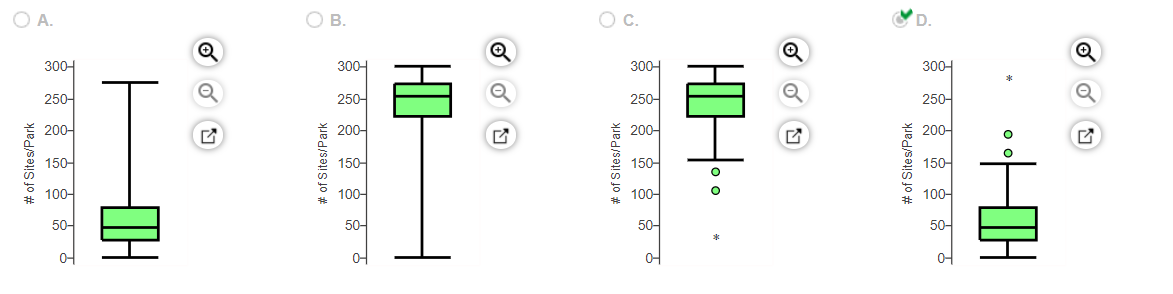
d) Describe the distribution.
The distribution is ___________ and __________
11. Describe what these boxplots tell you about the relationship between the number of cylinders a car’s engine has and the car’s fuel economy (mpg).
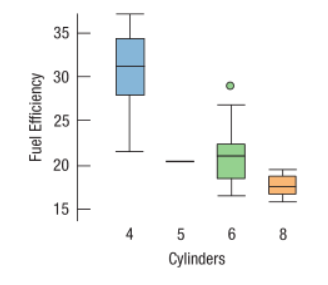
Select all that apply.
- These boxplots show that as the number of cylinders increases, fuel economy tends to decrease.
- These boxplots show that as the number of cylinders increases, fuel economy tends to become more variable.
- These boxplots show that as the number of cylinders increases, fuel economy tends to increase.
- These boxplots show that as the number of cylinders increases, fuel economy tends to become less variable
12. A university teacher saved every e-mail from students in a large introductory statistics class during an entire term. He then counted, for each student who had sent him at least one e-mail, how many e-mails each student had sent. What does the accompanying histogram say about the distribution of e-mails sent by students?
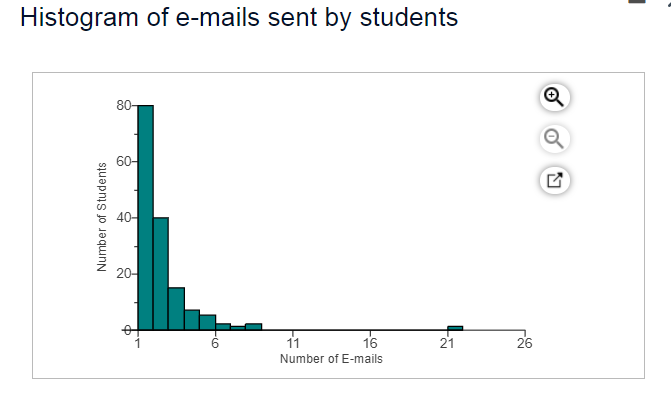
Choose the correct answer below.
- The histogram is skewed right. It was most common for students to send four or five e-mail messages. There was one outlier that sent 21 e-mails.
- The histogram is skewed right. It was most common for students to send just one or two e-mail messages, and most sent five messages or fewer. There was one outlier that sent 21 e-mails.
- The histogram is skewed left. It was most common for students to send just one or two e-mail messages, and most sent five messages or fewer. There was one outlier that sent 21 e-mails.
- The histogram is unimodal and roughly symmetric. It was most common for students to send just one e-mail message, with very few sending fewer than one or more than five messages.
13. When comparing the boxplots of two groups which of the following should be done?
Select all the correct answers below.
- Compare IQRs, are the spreads similar or different
- Compare medians, which group is the highest
- Check for possible outliers
- Compare shapes, for example, are the boxplots symmetric or skewed
14. A heart study recorded the cholesterol levels of more than 1400 participants. The accompanying graph is an ogive of the distribution of these cholesterol measures. (An ogive shows the percentage of cases at or below a certain value.) Construct a boxplot for these data, and write a few sentences describing the distribution.
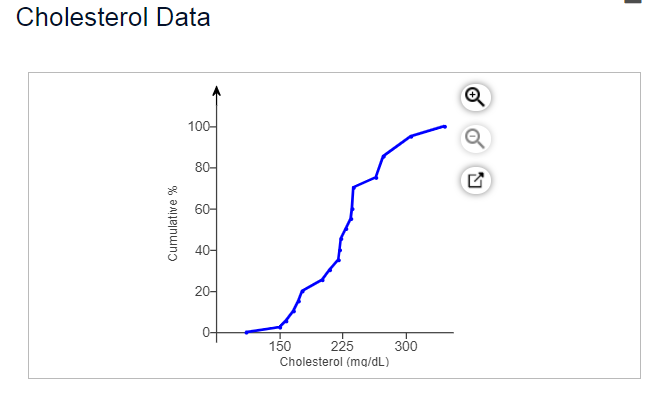
Construct a boxplot for these data. Choose the correct boxplot below.
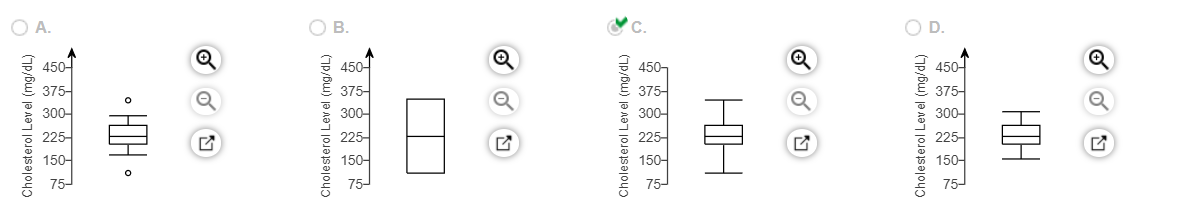
Write a few sentences describing the distribution.
The distribution of cholesterol levels is _________
The typical cholesterol level is about ________mg/dL. Most cholesterol levels are between first quartile ___________mg/dL and third quartile ________mg/dL. (Round to the nearest whole number as needed.)
or chat with our tutors