
Navigation » List of Schools, Subjects, and Courses » Math 2210 – Statistics » Exams » Exam 3
No Answers We dont have answer to this question yet. If you need help with your homework send us an email  or chat with our tutors
Exam 3
Exam3
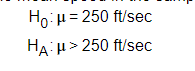
1. A golf association sets performance standards for golf balls. For example, the initial velocity of the ball may not exceed 250 feet per second when measured by an apparatus approved by the association. Suppose a manufacturer introduces a new kind of ball and provides a randomly selected sample of balls for testing. Based on the mean speed in the sample, the association comes up with a P-value of 0.35. Explain in this context what the 35% represents.
Choose the correct answer below.
- There is a 35% chance that the mean velocity of all such balls is greater than 250 ft/sec.
- Assuming that the ball meets the association’s velocity standard, there is a 35% chance that the mean velocity of some sample would be at least as high as the mean velocity found in the association’s sample.
- Assuming that the ball does not meet the association’s velocity standard, there is a 35% chance that the mean velocity of some sample would be at least as high as the mean velocity found in the association’s sample.
- Assuming that the ball meets the association’s velocity standard, there is a 35%chance that the mean velocity of some sample would be lower than the mean velocity found in the association’s sample.
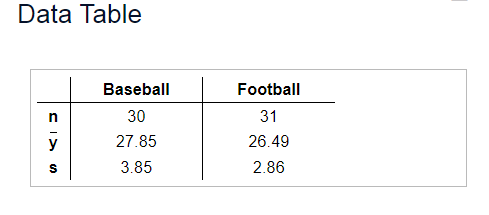
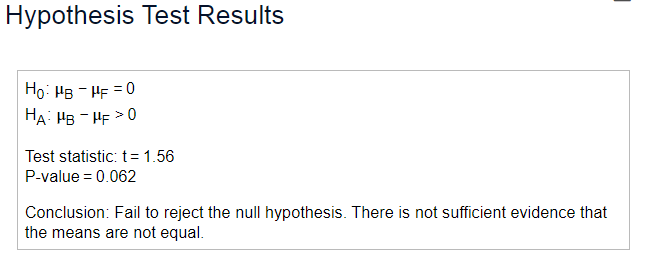
2. A sports reporter suggests that professional baseball players must be, on average, older than professional football players, since football is a contact sport and players are more susceptible to concussions and serious injuries. One player was selected at random from each team in both a certain professional baseball league and a certain professional football league. The data are summarized in the accompanying table. The degrees of freedom formula gave 53.50 df. The researchers tested the hypothesis at α=0.05; the results are given in the accompanying summary. Repeat this test, but assume that the variances of ages are the same in the two leagues. Did the conclusion change? Why do you think that is?
t=
Find the P-value.
The P-value is
State the conclusion. Choose the correct answer below.
- Fail to rejectthe null hypothesis. There issufficient evidence that the means are not equal.
- Fail to rejectthe null hypothesis. There is not sufficient evidence that the means are not equal
- Reject the null hypothesis. There is not sufficient evidence that the means are not equal.
- Reject the null hypothesis. There is sufficient evidence that the means are not equal.
Did the conclusion change? Why do you think that is?
- The conclusion did not change. This is because assuming the variances are equal never affects any of the calculations involved in the hypothesis test.
- The conclusion did not change. Because the sample standard deviations are similar, the pooled test is nearly the same as the two-sample t-test.
- The conclusion changed. This is because the pooled standard error is much larger than the standard error used in the original test, which results in a smaller test statistic.
- The conclusion changed. This is because the pooled standard error is much smaller than the standard error used in the original test, which results in a larger test statistic.
- The conclusion changed. Because the sample standard deviations are nearly the same and the sample sizes are large, pooling drastically changes the test statistic.
3. Statistics from a college’s climate center indicate that the city the college is in gets an average of 35.7” of rain each year, with a standard deviation of 4.5”. Assume that a Normal model applies. Complete parts a through d below.
a) During what percentage of years does this city get more than 39” of rain? The percentage of years with more than 39” of rain is _______
b) Less than how much rain falls in the driest 30% of all years? The driest 30% of all years get at most _____ of rain
c) A university student is in this city for 7 Let y represent the mean amount of rain for those 7 years. Describe the sampling distribution model of this sample mean, y. Select the correct choice below and, if necessary, fill in the answer boxes to complete your choice.
- Normal model with mean _____ and standard deviation ______
- A Binomial model with________ trials and a probability of success of _______
- There is no model that fits this distribution.
d) What’s the probability that those 7 years average less than 31” of rain? The probability that those 7 years average less than 31” of rain is _______
4. Which of the following are true? If false, explain briefly.
a) A very low P-value provides evidence against the null hypothesis.
b) A high P-value is strong evidence in favor of the null hypothesis.
c) A P-value above 0.10 shows that the null hypothesis is true.
d) If the null hypothesis is true, you can’t get a P-value below 0.01.
a) Choose the correct answer below.
- True.
- False. A very low P-value provides evidence for the null hypothesis.
- False. A very low P-value can be used as proof for the alternative hypothesis.
- False. A very low P-value provides evidence against the alternative hypothesis.
b) Choose the correct answer below.
- False. Whether a P-value provides evidence for the null hypothesis depends on the alpha level.
- False. A high P-value merely means that the data are consistent with the null hypothesis.
- True.
- False. A high P-value provides evidence against the null hypothesis.
c) Choose the correct answer below.
- True.
- False. No P-value ever shows that the null hypothesis is true (or false).
- False. This P-value shows that the null hypothesis is false.
- False. Whether a P-value shows that the null hypothesis is true depends on the alpha level.
d) Choose the correct answer below.
- False. Whether the null hypothesis is true has no effect on the P-value.
- False. If the null hypothesis is true, you can’t get a P-value above 0.01.
- False. You will get a P-value below 0.01 about once in a hundred times.
- True.
5.
6. A test preparation company claims that more than 60% of the students who take their GRE prep course improve their scores by at least 10 points.
a) Is the alternative to the null hypothesis more naturally one-sided or two-sided? Explain.
b) A test run with randomly selected participants gives a P-value of 0.975. What do you conclude?
c) What would you have concluded if the P-value had been 0.022?
a) The alternative hypothesis is more naturally ______ because the company is interested in knowing if the course leads to ______
b) If the P-value is 0.975, then there ______________ evidence to conclude that the course improves scores for _______60% of students by more than 10 points.
c) If the P-value is 0.022, then there ______ evidence to conclude that the course improves scores for _____________60% of students by more than 10 points.
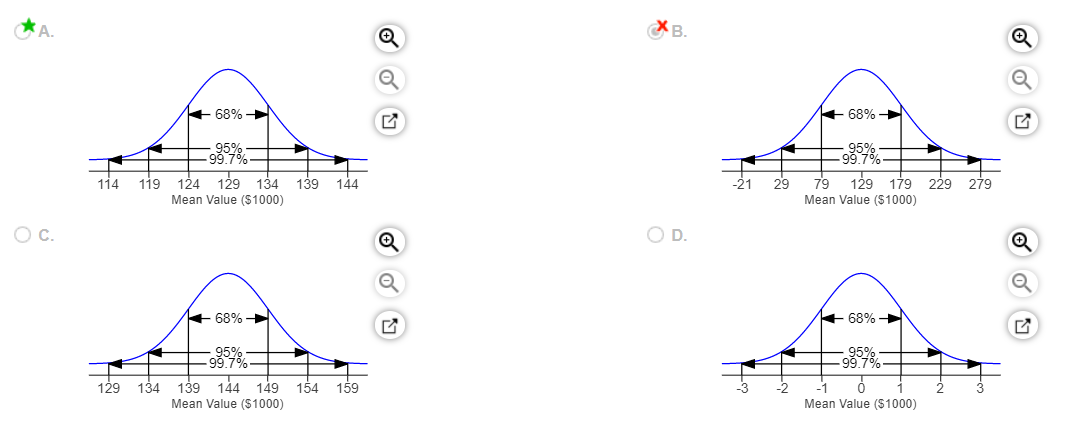
7. Assessment records indicate that the value of homes in a small city is skewed right, with a mean of
$129,000 and standard deviation of $50,000. To check the accuracy of the assessment data, officials plan to conduct a detailed appraisal of 100 homes selected at random. Using the 68-95-99.7 Rule, draw and label an appropriate sampling model for the mean value of the homes selected.
Choose the correct graph below.
8. A reputable polling organization in a certain country surveyed 104,900 adults, and 20% of those polled reported that they smoked. Complete parts a and b below.
a) Calculate the margin of error for the proportion of all adults who smoke with 90% confidence. ME = ______
b) Explain what this margin of error means. Select the correct choice below and fill in the answer box within your choice. (Round to four decimal places as needed.)
- We are 90% confident that the observed proportion of adults that smoke is within ___________ of the population proportion.
- The probability that any given adult surveyed from the population smokes is ______
- The probability that any given adult surveyed from the sample smokes is ______
- We are 90% confident that the observed proportion of adults that smoke is within ________ of the same proportion
9. A new reading program may reduce the number of elementary school students who read below grade level. The company that developed this program supplied materials and teacher training for a large-scale test involving nearly 9,900 children in several different school districts. Statistical analysis of the results showed that the percentage of students who did not meet the grade-level goal was reduced from 16.9% to 16%. The hypothesis that the new reading program produced no improvement was rejected with a P-value of 0.031. Complete parts a) and b) below.
a) Explain what the P-value means in this context. Choose the correct answer below.
- There is only a 3.1% chance of seeing a sample proportion of 16.9% (or more) of students failing the test by natural sampling variation if 16% is the true population value.
- There is a 96.9% chance of seeing a sample proportion of 16.9% (or more) of students failing the test by natural sampling variation if 16% is the true population value.
- There is only a 3.1% chance of seeing a sample proportion of 16% (or less) of students failing the test by natural sampling variation if 16.9% is the true population value.
- There is only a 96.9% chance of seeing a sample proportion of 16% (or less) of students failing the test by natural sampling variation if 16.9% is the true population value.
b) Even though this reading program has been shown to be significantly better, why might you not recommend that your local school adopt it?
- Under the old methods, 1,673 students would be expected to fail. With the new program, 1,584 failed. This is only a decrease of 89 students. It would depend on the costs of switching to the new program.
- Under the old methods, 1,584 students would be expected to fail. With the new program, 1,673failed. The school would not want to adopt a new reading program that increases the number of students who fail.
- You might not recommend that your school adopt the new program because the sample was not chosen at random, thus compromising the results.
- You might not recommend that your school adopt the new program because the sample size of the test was not large enough to come to a decision.
10. One kind of scale for weighing trucks can measure their weight as they drive across a plate. However, it is not known whether this method is equivalent to the traditional method of static weighing. Find a 95% confidence interval of the weight differences. Interpret this interval in context.
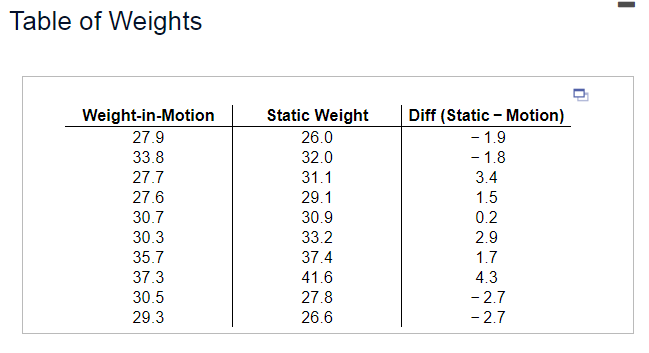
The confidence interval is ______________
Interpret this interval. Choose the correct answer below.
- About 95% of all samples of trucks will have a mean difference between static weight and weight-in-motion that falls within this interval.
- The true mean difference between static weight and weight-in-motion for all trucks falls within this interval 95% of the time.
- There is a 95% chance that this interval captures the mean difference between static weight and weight-in-motion of the population of trucks.
- One can have 95% confidence that this interval captures the true mean difference between the static weight and weight-in-motion for all trucks.
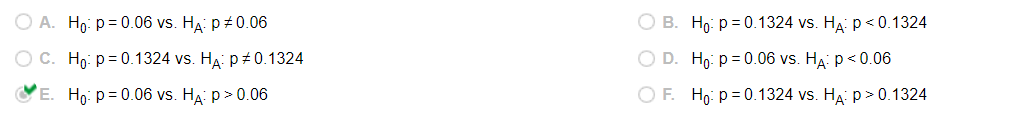
11. It the 1980s, it was generally believed that congenital abnormalities affected about 6% of a large nation’s children. Some people believe that the increase in the number of chemicals in the environment has led to an increase in the incidence of abnormalities. A recent study examined 423 randomly selected children and found that 56 of them showed signs of an abnormality. Is this strong evidence that the risk has increased? (We consider a P-value of around 5% to represent reasonable evidence.) Complete parts a through f. Assume the independence assumption is met.
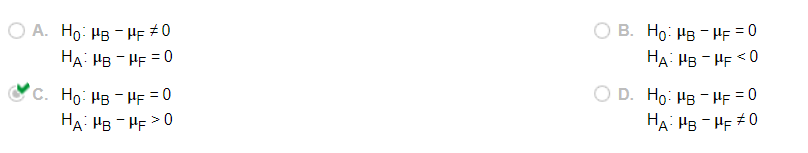
a) Write appropriate hypotheses. Let p be the proportion of children with genetic abnormalities. Choose the correct answer below.
b) Check the necessary assumptions. Which of the following are satisfied? Select all that apply.
- The independence assumption is satisfied.
- The sample is random.
- Less than 10% of the population was sampled.
- There are more than 10 successes and 10 failures.
c) Perform the mechanics of the test. What is the P-value?
P-value=_______
(Round to three decimal places as needed.)
d) Explain carefully what the P-value means in this context. Choose the correct answer below.
- The P-value is the chance of observing 56 or more children with genetic abnormalities in a random sample of 423 children.
- The P-value is the actual percentage of children who have genetic abnormalities.
- The P-value is the chance of observing 56 or more children with genetic abnormalities in a random sample of 423 children if 6% of children actually have genetic abnormalities.
- The P-value is the chance of observing 6% of children with genetic abnormalities.
e) What’s your conclusion?
- Fail to reject H0. There is sufficient evidence that more than 6% of the nation’s children have genetic abnormalities.
- Reject H0. There is not sufficient evidence that more than 6% of the nation’s children have genetic abnormalities.
- Fail to reject H0. There is not sufficient evidence that more than 6% of the nation’s children have genetic abnormalities.
- Reject H0. There is sufficient evidence that more than 6% of the nation’s children have genetic abnormalities.
f) Do environmental chemicals cause congenital abnormalities?
- No, the conclusion of the hypothesis test shows that environmental chemicals do not cause genetic abnormalities.
- Yes, the conclusion of the hypothesis test shows that environmental chemicals cause genetic abnormalities.
- It is unknown if environmental chemicals cause genetic abnormalities, because the hypothesis test does not indicate the cause of any changes.
12. A reputable medical journal reported on an experiment intended to see if a certain drug could be used as a treatment for the eating disorder anorexia nervosa. The subjects, women being treated for anorexia, were randomly divided into two groups. Of the 50 who received the drug, 36 were deemed healthy a year later, compared to 32 of the 44 who got the placebo. Complete parts a through c below.
a) Are the conditions for inference satisfied? Select all that apply.
- Yes, all conditions are satisfied or can be assumed to be satisfied.
- No, the Success/Failure Condition is not satisfied or cannot be assumed to be satisfied.
- No, the Independence Assumption is not satisfied or cannot be assumed to be satisfied.
- No, the Independent Groups Assumption is not satisfied or cannot be assumed to be satisfied.
b) Find a 90% confidence interval for the difference in outcomes. Let the women who received the drug be sample 1 and let the women who received the placebo be sample 2.
The 90% confidence interval is _______ (Round to three decimal places as needed. Use ascending order.)
c) Use the confidence interval to explain whether the drug is effective.
Because ____________ _____________ the confidence interval, there’s _____________ difference between the drug and the placebo.
13. For each of the following situations, state whether a Type I, a Type II, or neither error has been made.
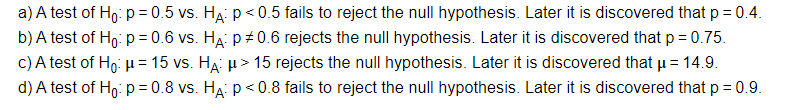
a) What type of error, if any, has been made?
- A Type II error occurred because the null hypothesis should have been rejected.
- A Type I error occurred because the null hypothesis should not have been rejected.
- A Type II error occurred because the null hypothesis should not have been rejected.
- No error occurred because the null hypothesis was rightfully rejected.
- No error occurred because the null hypothesis was rightfully not rejected.
- A Type I error occurred because the null hypothesis should have been rejected.
b) What type of error, if any, has been made?
- A Type II error occurred because the null hypothesis should not have been rejected.
- No error occurred because the null hypothesis was rightfully rejected.
- A Type II error occurred because the null hypothesis should have been rejected.
- A Type I error occurred because the null hypothesis should not have been rejected.
- A Type I error occurred because the null hypothesis should have been rejected.
c) What type of error, if any, has been made?
- No error occurred because the null hypothesis was rightfully rejected.
- A Type I error occurred because the null hypothesis should not have been rejected.
- A Type II error occurred because the null hypothesis should have been rejected.
- A Type II error occurred because the null hypothesis should not have been rejected.
- No error occurred because the null hypothesis was rightfully not rejected.
- A Type I error occurred because the null hypothesis should have been rejected.
d) What type of error, if any, has been made?
- A Type I error occurred because the null hypothesis should have been rejected.
- A Type II error occurred because the null hypothesis should not have been rejected.
- A Type II error occurred because the null hypothesis should have been rejected.
- A Type I error occurred because the null hypothesis should not have been rejected.
- No error occurred because the null hypothesis was rightfully rejected.
- No error occurred because the null hypothesis
or chat with our tutors