
Navigation » List of Schools, Subjects, and Courses » Math 136 – Introduction to Statistics » Homeworks » Section 2.2 Homework
No Answers We dont have answer to this question yet. If you need help with your homework send us an email  or chat with our tutors
Section 2.2 Homework
Section 2.2 Homework
1. Select the correct choices that complete the sentence below.
The ______ class limit is the smallest value within the class and the ______ class limit is the largest value within the class.
2. Is the statement below true or false? There is not one particular frequency distribution that is correct, but there are frequency distributions that are less desirable than others.
- The statement is true. Any correctly constructed frequency distribution is valid. However, some choices for the categories or classes give more information about the shape of the distribution.
- The statement is true. Any correctly constructed frequency distribution is valid. However, some are less desirable because they take up more space.
- The statement is false. There is only one correct frequency distribution for any given data set.
- The statement is false. All correctly constructed frequency distributions for a given data set are valid and give the same information.
3. Determine whether the following statement is true or false. The shape of the distribution shown is best classified as skewed left. Choose the correct answer below.
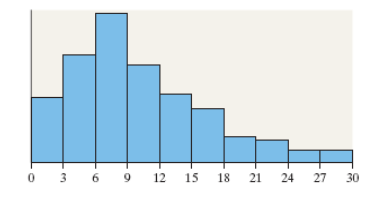
- False
- True
4. The following frequency histogram represents the IQ scores of a random sample of seventh-grade students. IQs are measured to the nearest whole number. The frequency of each class is labeled above each rectangle. Use the histogram to answers parts (a) through (g).
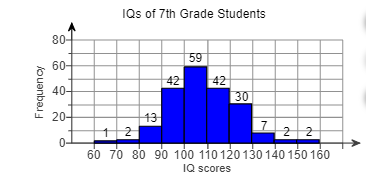
(a) How many students were sampled? ____ students
(b) Determine the class width. The class width is ____
(c) Identify the classes and their frequencies. Choose the correct answer below.
- 60-69, 1; 70-79, 2; 80-89, 13; 90-99, 42; 100-109, 59; 110-119, 42; 120-129, 30; 130-139, 7; 140-149, 2; 150-159, 2
- 60-70, 1; 70-80, 2; 80-90, 13; 90-100, 42; 100-110, 59; 110-120, 42; 120-130, 30; 130-140,140-150, 2; 150-160, 2
- 65, 1; 75, 2; 85, 13; 95, 42; 105, 59; 115, 42; 125, 30; 135, 7; 145, 2; 155, 2
(d) Which class has the highest frequency?
- 90-99
- 105
- 100-109
- 100-110
(e) Which class has the lowest frequency?
- 60-70
- 65
- 150-159
- 60-69
(f) What percent of students had an IQ of at least 130?
(g) Did any students have an IQ of 164?
- Yes, because there is a bar in the 150-159 class.
- Yes, because there is a frequency of a score of 165.
- No, because there are no bars, or frequencies, greater than an IQ of 160.
- No, because there is a bar in the 150-159 class.
5. For IQ scores of students, state whether you would expect a histogram of the data to be bell-shaped, uniform, skewed left, or skewed right. Choose the correct answer below.
- Uniform
- Skewed Right
- Skewed Left
- Bell Shaped
6. Determine the original set of data.
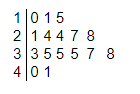
The original set of data is _____________________
7. The data to the right represent the top speed (in kilometers per hour) of all the players (except goaltenders) in a certain soccer league. Find (a) the number of classes, (b) the class limits for the third class, and (c) the class width.
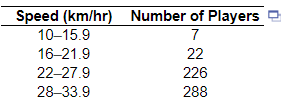
(a) There are ___ classes.
(b) The lower class limit for the third class is ____
The upper class limit for the third class is ____
(c) The class width is ____
8. The accompanying table shows the median household income (in dollars) for 25 randomly selected regions. Complete parts (a) through (g) below.
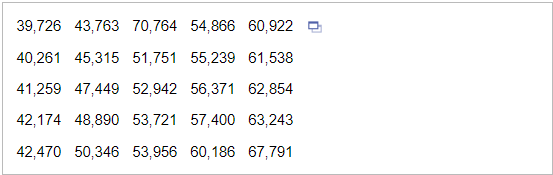
(a) Construct a frequency distribution. Use a first class having a lower class limit of 35,000 and a class width of
9. The accompanying table shows the tax, in dollars, on a pack of cigarettes in 30 randomly selected cities. Complete parts (a) through (g) below.
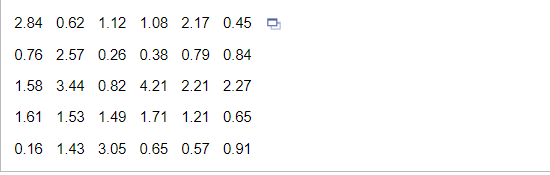
(a) Construct a frequency distribution. Use a first class having a lower class limit of 0 and a class width of 0.50.
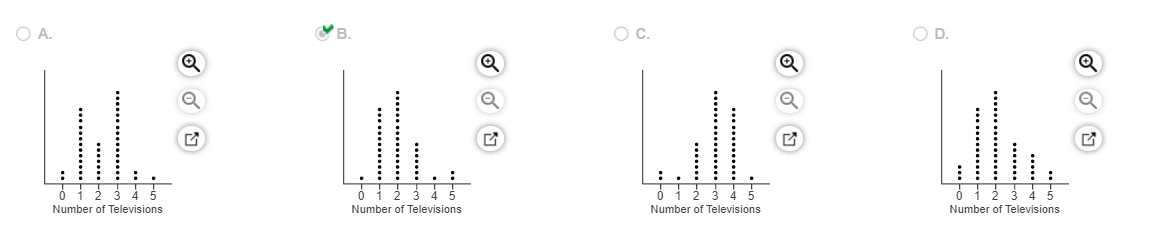
10. A researcher wanted to determine the number of televisions in households. He conducts a survey of 40 randomly selected households and obtained the data to the right. Draw a dot plot of the televisions per household.
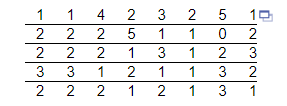
Choose the correct dot plot below.
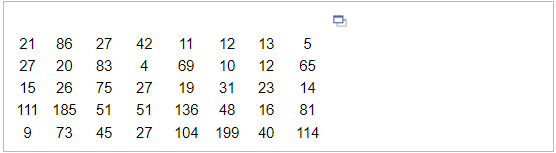
11. An Internet media and market research firm measured the amount of time an individual spends viewing a specific Webpage. The data in the accompanying table represent the amount of time, in seconds, a random sample of 40 surfers spent viewing a Webpage. Create the graphical summary. Write a sentence that describes the data.
Create the graphical summary. Choose the correct graph below.
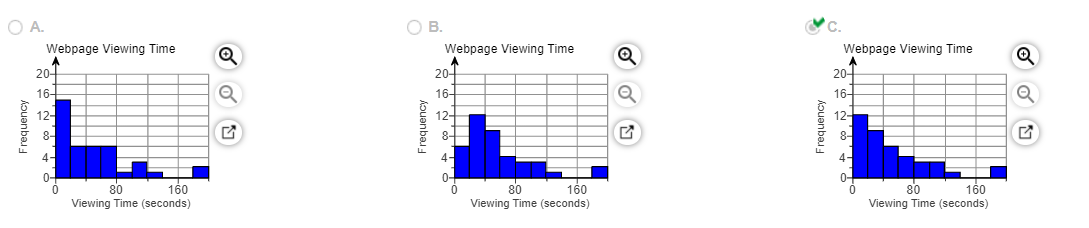
Write a sentence that describes the data. Choose the correct answer below.
- The distribution is uniform.
- The distribution is bell shaped.
- The distribution is skewed left.
- The distribution is skewed right.
12. Why shouldn’t classes overlap when summarizing continuous data in a frequency or relative frequency distribution?Choose the correct answer below.
- Classes shouldn’t overlap so there is no confusion as to which class an observation belongs.
- Classes shouldn’t overlap so that they are open ended.
- Classes shouldn’t overlap so that the distribution is not skewed in one direction.
- Classes shouldn’t overlap so that the class width is as small as possible.
or chat with our tutors