
Navigation » List of Schools, Subjects, and Courses » Math 136 – Introduction to Statistics » Quiz » Quiz 2
No Answers We dont have answer to this question yet. If you need help with your homework send us an email  or chat with our tutors
Quiz 2
Quiz 2
1. Consider the information in the “Why we can’t lose weight” chart shown to the right, which is in the magazine style of graph. Could the information provided be organized into a pie chart? Why or why not?
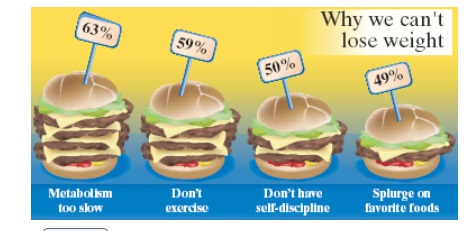
Choose the correct answer below.
- No. The percentages add up to more than 100%.
- Yes. The information could be organized into a pie chart.
- No. There are more than 3 categories of data.
- No. The values in the table are not decimals.
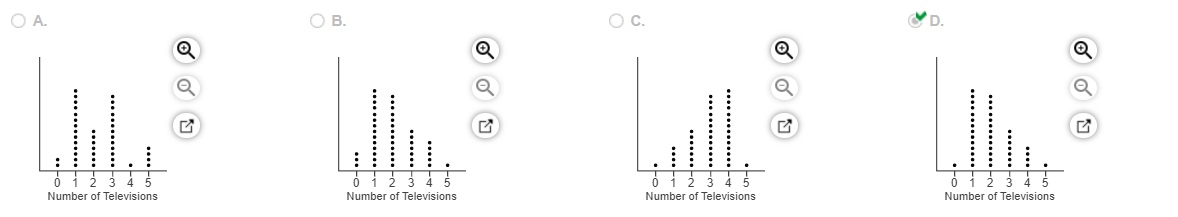
2. A researcher wanted to determine the number of televisions in households. He conducts a survey of 40 randomly selected households and obtained the data to the right. Draw a dot plot of the televisions per household.

Choose the correct dot plot below.
3. Determine whether the following statement is true or false. The shape of the distribution shown is best classified as skewed left.

Choose the correct answer below.
- True
- False
4. The following Pareto chart shows the position played by the most valuable player (MVP) in a certain baseball league for the last 89
years. Use the chart to answer parts (a) through (d).
(a) Which position had the most MVPs? The position with the most MVPs was ____
(b) How many MVPs played second base (2B)? _____ MVPs played second base.
(c) How many more MVPs played outfield (OF) than second base?
_______ more MVPs played outfield than second base. (Type a whole number.)
(d) There are three outfield positions (left field, center field, right field). Given this, how might the graph be misleading?
- The chart seems to show that one position has many more MVPs because three positions are combined into one. They should be separated.
- The positions or combinations of positions should be chosen so that all the bars are closer together in height.
- The graph is misleading because the bars are decreasing in height from left to right.
- All the information is true, so the graph is not misleading.
5. Determine whether the following statement is true or false. The shape of the distribution shown is best classified as uniform
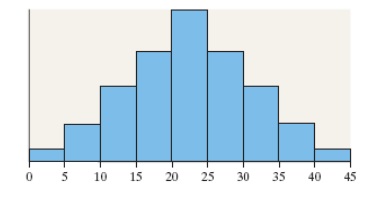
Choose the correct answer below.
- False
- True
6. Determine the original set of data.

The original set of data is
7. In a relative frequency distribution, what should the relative frequencies add up to? Select the correct choice and, if necessary, fill in the answer box to complete your choice.
- The relative frequencies add up to____
- The relative frequencies add up to the total number of observations.
8. The data in the table represent the tuition for all 2-year community colleges in a region in 2014-2015.
(a) Construct a cumulative frequency distribution.
(b) Construct a cumulative relative frequency distribution.
(c) Draw a frequency polygon.
(d) Draw a relative frequency ogive.

(a) Complete the cumulative frequency distribution.
| Tuition | Cumulative Frequency |
| 775-799 | |
| 800-824 | |
| 825-849 | |
| 850-874 | |
| 875-899 | |
| 900-924 | |
| 925-949 | |
| 950-974 |
(b) Complete the cumulative relative frequency distribution.
| Tuition | Cumulative Frequency |
| 775-799 | |
| 800-824 | |
| 825-849 | |
| 850-874 | |
| 875-899 | |
| 900-924 | |
| 925-949 | |
| 950-974 |
(c) Which of these is the frequency polygon?

9. The graph to the right represents the cost of movie rentals

(a) How is the graph misleading?
- The graph is not misleading.
- It looks like new releases are three times as expensive as bargain rentals.
- It looks like new releases cost about twice as much as regular rentals.
- It looks like more people rent new releases.
(b) What could be done to improve the graphic?
- The bargain rental bar should be made longer for emphasis.
- The graph does not need to be changed.
- The lengths of the bars should be half as long.
- The lengths of the bars should be proportional to the costs of the rentals.
10. The _________________ is the difference between consecutive lower class limits.
11. The pie chart below depicts the beverage size customers choose while at a fast food restaurant. Complete parts (a) through (c).
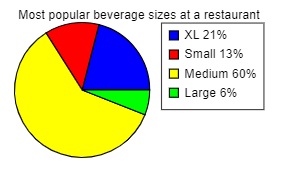
(a) What is the most popular size? What percentage of customers choose this size?
- XL; 21%
- Large; 6%
- Small; 13%
- Medium; 60%
(b) What is the least popular size? What percentage of customers choose this size?
- Large; 6%
- Small; 13%
- XL; 21%
- Medium; 60%
(c) What percent of customers choose a small-sized beverage?
- 61%
- 21%
- 19%
- 13%
12. An experiment was conducted in which two fair dice were thrown 100 times. The sum of the pips showing on the dice was then recorded. The frequency histogram to the right gives the results. Use the histogram to complete parts (a) through (f).
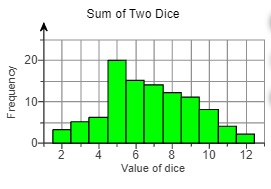
(a) What was the most frequent outcome of the experiment?
(b) What was the least frequent?
(c) How many times did we observe a 5?
(d) How many more 8’s were observed than 11’s?
(e) Determine the percentage of time a 5 was observed.
(f) Describe the shape of the distribution. Choose the correct answer below.
- Bell-shaped
- Skewed right
- Skewed left
- Uniform
13. The following data represent the number of grams of fat in breakfast meals offered at a local fast food restaurant. (a) Construct an ordered stem-and-leaf plot and (b) describe the shape of the distribution.

(a) Construct the ordered stem-and-leaf plot below
(b) The distribution is _____
14. sTo predict future enrollment in a school district, fifty households within the district were sampled, and asked to disclose the number of children under the age of five living in the household. The results of the survey arepresented in the table. Complete parts (a) through (c) below.
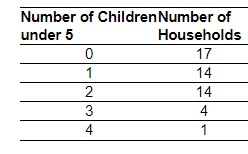
(a) Construct a relative frequency distribution of the data.
| Number of Children Under 5 | Relative Frequency |
| 0 | |
| 1 | |
| 2 | |
| 3 | |
| 4 |
(b) What percentage of households has two children under the age of 5?
(c) What percentage of households has one or two children under the age of 5?
or chat with our tutors