
Navigation » List of Schools, Subjects, and Courses » Math 138 – Statistics » Homeworks » 3.2 Homework
No Answers We dont have answer to this question yet. If you need help with your homework send us an email  or chat with our tutors
3.2 Homework
3.2 Homework
1. A survey was taken in which people were asked how many siblings they had. The following TI-84 Plus display presents some results.
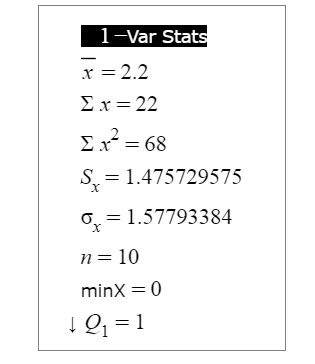
(a) Is this a population or a sample?
(b) What is the appropriate standard deviation? Include all digits displayed.
(c) What is the appropriate variance? Round to 7 decimal places.
2. Sports car or convertible? The following table presents the fuel efficiency, in miles per gallon, for a sample of convertibles and a sample of sports cars.
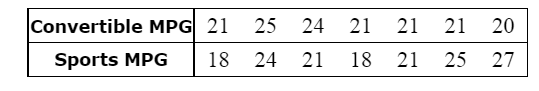
(a) Find the sample standard deviation of the mileage for the sample of convertibles. Round the answer to one decimal place as needed.
(b) Find the sample standard deviation of the mileage for the sample of sports cars. Round the answer to one decimal place as needed.
(c) Which sample has greater spread?
3. A sample has mean 67 and standard deviation 12
(a) What value is 0.5 standard deviations below the mean?
(b) What values are 3 standard deviations from the mean?
4. Pay your bills: In a large sample of customer accounts, a utility company determined that the average number of days between when a bill was sent out and when the payment was made is 32 with a standard deviation of 4 days. Assume the data to be approximately bell-shaped.
(a) Between what two values will approximately 95% of the numbers of days be?
(b) Estimate the percentage of customer accounts for which the number of days is between 28 and 36
(c) Estimate the percentage of customer accounts for which the number of days is between 20 and 44.
5. Newborn babies: A study conducted by the Center for Population Economics at the University of Chicago studied the birth weights of 673 babies born in New York. The mean weight was 2934 grams with a standard deviation of 880 grams. Assume that birth weight data are approximately bell-shaped. Estimate the number of newborns who weighed between 2054 grams and 3814 grams. Round to the nearest whole number.
The number of newborns who weighed between 2054 grams and 3814 is
6. Empirical Rule OK? The following histogram presents a data set with a mean of 4 and a standard deviation of 12.
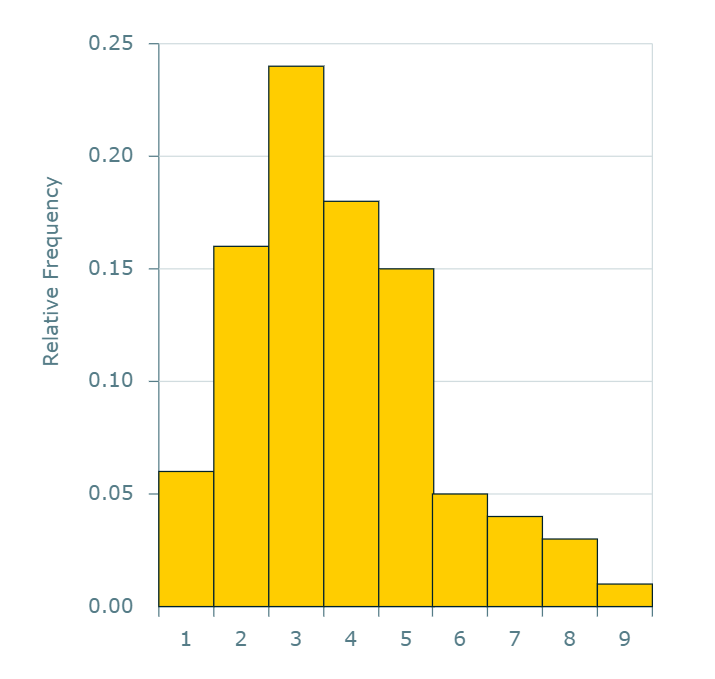
It _______________ to use the Empirical Rule to approximate the proportion of the data between -20 and 28.
.
or chat with our tutors