
Navigation » List of Schools, Subjects, and Courses » Math 120 – Introductory Probability and Statistics » Homeworks » Homework 5
No Answers We dont have answer to this question yet. If you need help with your homework send us an email  or chat with our tutors
Homework 5
Homework 5
1. What is an ogive?
Choose the correct answer below.
- A graph that represents the cumulative frequency or cumulative relative frequency for the class
- A bar graph whose bars are drawn in decreasing order of frequency or relative frequency
- A circle divided into sectors, each sector representing a category of data
- A graph that uses points, connected by line segments, to represent the frequency or relative frequency for each class
2. The accompanying relative frequency ogive represents the composite score on a standardized test for a high school graduating class. Complete parts (a) through (d) below.
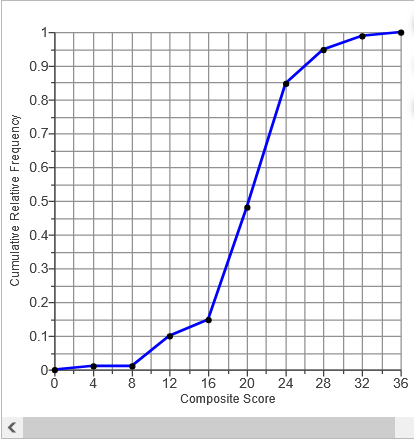
(a) What is the class width? (Type a whole number.)
(b) Approximately 15% of students had a composite score below what level? (Type a whole number.)
(c) What percentage of students had a composite score less than 24% (Type a whole number.)
(d) Five percent of students had a composite score above what level? (Type a whole number.)
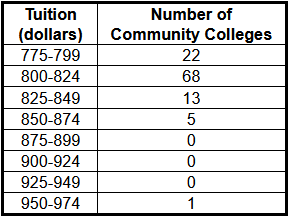
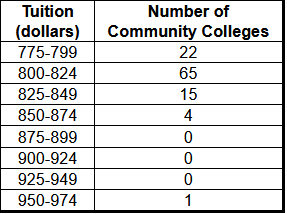
3. The data in the table represent the tuition for all 2-year community colleges in a region in 2014-2015.
(a) Construct a cumulative frequency distribution.
(b) Construct a cumulative relative frequency distribution.
(c) Draw a frequency polygon.
(d) Draw a relative frequency ogive.
(a) Complete the cumulative frequency distribution.
b) Complete the cumulative relative frequency distribution.
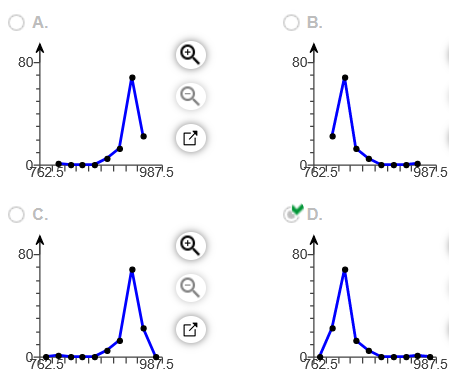
(c) Which of these is the frequency polygon?
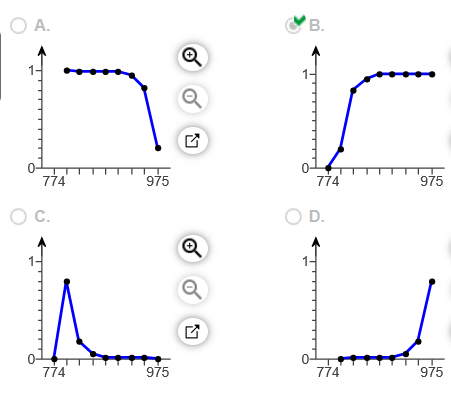
(d) Which of these is the relative frequency ogive?
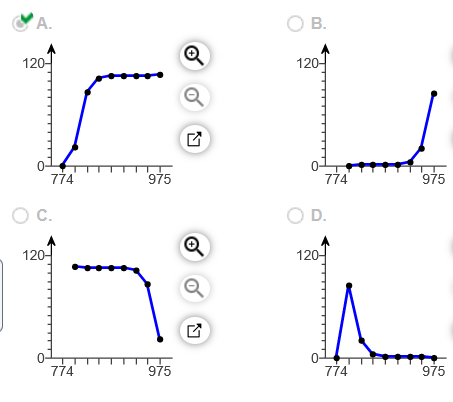
4. The data in the table represent the tuition for all 2-year community colleges in a region in 2009-2010.
(a) Draw a frequency ogive.
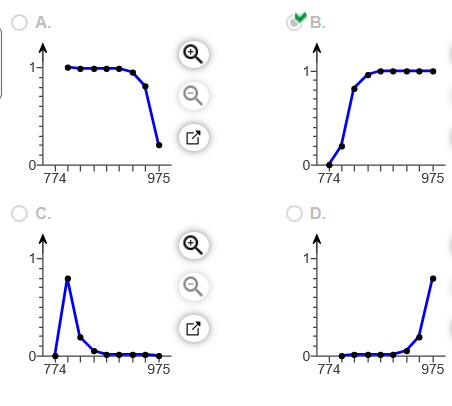
(b) Draw a relative frequency ogive.
(a) Which of the following graphs is the frequency ogive?
(b) Which of the following graphs is the relative frequency ogive?
5. Determine the original set of data.
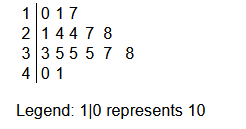
The original set of data is
6. The following data represent the ages of award winners for best actor and best actress in a leading role for the 20 years from 1985 to 2004. Answer parts (a)-(b) below.

(a) Construct an ordered back to back stem-and-leaf display.
(b) Compare the two populations. What can you conclude from the back to back stem-and-leaf display?
- While most men and most women receive an award in their thirties, men tend to receive the award at a younger age on average than women do.
- Both men and women receive more awards on average as they get older.
- While most men and most women receive an award in their thirties, women tend to receive the award at a younger age on average than men do.
- Most men and most women receive awards in their twenties and thirties.
or chat with our tutors