
Navigation » List of Schools, Subjects, and Courses » Math 227 – Statistics » Homeworks » Chapter 1 Homework
No Answers We dont have answer to this question yet. If you need help with your homework send us an email  or chat with our tutors
Chapter 1 Homework
Chapter 1 Homework
1. Define statistics.
Choose the correct answer below.
- Statistics encompasses all scientific disciplines in which percentages are used, data are analyzed, and probabilities are found. In addition, statistics references any mathematical model which is reported using percentages or proportions.
- Statistics is the science of manipulating, reorganizing, and editing information to produce the desired results. In addition, statistics is about providing the required answer with the desired level of confidence.
- Statistics is the science of collecting, organizing, summarizing, and analyzing information to draw a conclusion and answer questions. In addition, statistics is about providing a measure of confidence in any conclusions.
- Statistics encompasses all scientific disciplines in which random occurrences are analyzed. In addition, statistics references any random occurrence which is reported using percentages or proportions.
2. A(n) __________ is a numerical summary of a sample. A(n) __________ is a numerical summary of a population.
3. Fill in the blank. _________ are the characteristics of the individuals of the population being studied.
4. Determine whether the underlined numerical value is a parameter or a statistic. Explain your reasoning. In a phone survey of 100 random homes in a country, 21% of families had garages.
Choose the correct answer below.
- Parameter, because the data set of all homes in a country is a population.
- Statistic, because the data set of all homes in a country is a sample.
- Parameter, because the data set of 100 random homes is a sample.
- Statistic, because the data set of all homes in a country is a population.
- Statistic, because the data set of 100 random homes is a sample.
- Parameter, because the data set of all homes in a country is a sample.
- Statistic, because the data set of 100 random homes is a population.
- Parameter, because the data set of 100 random homes is a population.
5. Determine whether the variable is qualitative or quantitative. Number of megabytes of RAM in a computer. Is the variable qualitative or quantitative?
- The variable is qualitative because it is an attribute characteristic.
- The variable is qualitative because it is a numerical measure.
- The variable is quantitative because it is an attribute characteristic.
- The variable is quantitative because it is a numerical measure.
6. Determine whether the quantitative variable is discrete or continuous. Number of bacteria seen on a microscope slide. Is the variable discrete or continuous?
- The variable is continuous because it is countable.
- The variable is continuous because it is not countable.
- The variable is discrete because it is not countable.
- The variable is discrete because it is countable.
7. Determine the level of measurement of the variable. Hair colors. Choose the correct level of measurement.
- Interval
- Nominal
- Ordinal
- Ratio
8. Determine the level of measurement of the variable below. Nation of origin Choose the correct answer below.
- Interval
- Nominal
- Ratio
- Ordinal
9. Determine the level of measurement of the variable. Monthly temperatures: 63° F, 69° F, 75° F, 81° F, and 87° F. Choose the correct answer below.
- Nominal
- Ordinal
- Interval
- Ratio
10. A polling organization contacts 1584 male university graduates who have a white collar job and asks whether or not they had received a raise at work during the past 4 months. What is the population in the study?
- Male university graduates who have a white collar job.
- Male university graduates.
- Male university graduates who have received a raise at work.
- Male university graduates who have a white collar job and have received a raise at work.
What is the sample in the study?
- The 1584 male university graduates who have received a raise at work.
- Male university graduates.
- The 1584 male university graduates who have a white collar job.
- Male university graduates who have a white collar
11. The data on the right relate to characteristics of high-definition televisions A through E. Identify the individuals, variables, and data corresponding to the variables. Determine whether each variable is qualitative, continuous, or discrete.
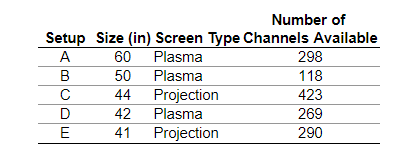
What are the individuals being studied?
- The high-definition television setups A through E.
- Plasma and projection widescreen high-definition televisions.
- Television setups that include more than 100 channels.
- Televisions with screen sizes between 40 in and 60 in.
What are the variables and their corresponding data being studied?
- Size (60, 50, 44, 42, 41), screen type (Plasma, Plasma, Projection, Plasma, Projection), and number of channels available (298, 118, 423, 269, 290)
- Size (60, 50, 44, 42, 41) and number of channels available (298, 118, 423, 269, 290)
- Setup (A, B, C, D, E), size (60, 50, 44, 42, 41), screen type (Plasma, Plasma, Projection, Plasma, Projection), and number of channels available (298, 118, 423, 269, 290)
Determine whether each variable is qualitative, continuous, or discrete.
Size is a _______ variable.
Screen type is a ______ variable.
Number of channels available is a ______variable.
12. Researchers studied 600 people and matched their personality type to when in the year they were born. They discovered that the number of people with a “cyclothymic” temperament, characterized by rapid, frequent swings between sad and cheerful moods, was significantly higher in those born in the summer. The study also found that those born in the winter were less likely to be irritable, while those born in autumn were less likely to be excessively positive.
Complete parts (a) through (e) below.
(a) What is the research question the study addresses?
- Does year of birth affect mood?
- Are people born in autumn excessively positive?
- Does season of birth affect mood?
- Are people born in winter irritable?
(b) What is the sample?
- All people born in the autumn
- The 600 people who are excessively positive, irritable, or have mood swings
- All people
- The 600 people in the study
(c) What type of variable is the season in which you were born?
- Quantitative, discrete, ratio
- Quantitative, continuous, interval
- Qualitative, nominal
- Quantitative, continuous, ratio
- Quantitative, discrete, interval
- Qualitative, ordinal
(d) What can be said (in general) about individuals born in summer? Autumn?
People born in summer are ______ to ______
What can be said (in general) about individuals born in autumn?
People born in autumn are ___________to ___________
(e) What conclusion was drawn from the study?
- Being born in winter makes one irritable.
- Year of birth plays no significant role in one’s temperament.
- Season of birth plays a role in one’s temperament.
- Being born in autumn makes one excessively positive.
13. What is an observational study? What is a designed experiment? Which allows the researcher to claim causation between an explanatory variable and a response variable? What is an observational study?
- An observational study is a list of all individuals in a population along with certain characteristics of each individual.
- An observational study measures the value of the response variable without attempting to influence the value of either the response or explanatory variables.
- An observational study is when a researcher assigns individuals to a certain group, intentionally changing the value of an explanatory variable, and then recording the value of the response variable for each group.
What is a designed experiment?
- A designed experiment is a list of all individuals in a population along with certain characteristics of each individual.
- A designed experiment is when a researcher assigns individuals to a certain group, intentionally changing the value of an explanatory variable, and then recording the value of the response variable for each group.
- A designed experiment measures the value of the response variable without attempting to influence the value of either the response or explanatory variables.
Which allows the researcher to claim causation between an explanatory variable and a response variable?
________________ allows the researcher to claim causation between an explanatory variable and a response variable
14. Determine whether the study depicts an observational study or an experiment. Fifty patients with heart arrhythmias are divided into two groups. One group receives a new drug to regulate heart rhythm, the other a placebo. After one month, the presence of arrhythmias is measured.
Does the description correspond to an observational study or an experiment?
- The study is an experiment because the study examines individuals in a sample, but does not try to influence the variable of interest.
- The study is an observational study because the study examines individuals in a sample, but does not try to influence the response variable.
- The study is an experiment because the researchers control one variable to determine the effect on the response variable.
- The study is an observational study because the researchers control one variable to determine the effect on the response variable.
15. Determine whether the study depicts an observational study or an experiment. Tenth-grade students are randomly divided into two groups. One group is taught English using traditional techniques. The other is taught English using a reform method. After 1 year, each group is given an achievement test to compare its proficiency with that of the other group.
Choose the correct description of the study.
- The study is an experiment because the researchers control one variable to determine the effect on the response variable.
- The study is an observational study because the researchers control one variable to determine the effect on the response variable.
- The study is an experiment because the study examines individuals in a sample, but does not try to influence the variable of interest.
- The study is an observational study because the study examines individuals in a sample,
16. Select the correct choices that complete the sentence below.
In statistical studies, researchers want to determine how varying one or more _______ variables may impact the value of a(n) _______ variable.
17. What does it mean when sampling is done without replacement? Choose the correct answer below.
- Once a sample is taken, those individuals are no longer considered part of the population.
- Once an individual is selected, the individual cannot be selected again.
- Once a sample is taken, those individuals cannot be selected for any other samples.
- Once an individual is selected, the individual can be selected again.
18. Which sampling method does not require a frame? Choose the correct answer below.
- Simple random
- Systematic
- Cluster
- Stratified
- All of the above sampling methods require a frame
19. A(n) _______ is obtained by dividing the population into groups and selecting all individuals from within a random sample of the groups.
20. A(n) ____________is obtained by dividing the population into homogeneous groups and randomly selecting individuals from each group.
21. Nissan wants to administer a satisfaction survey to its current customers. Using their customer database, the company randomly selects 60 customers and asks them about their level of satisfaction with the company.
What type of sampling is used?
- Systematic
- Stratified
- Cluster
- Simple random
- Convenience
22. A newspaper asks its readers to call in their opinion regarding their taste in reading.
What type of sampling is used?
- Systematic
- Convenience
- Simple random
- Cluster
- Stratified
23. A salesperson obtained a systematic sample of size 20 from a list of 500 clients. To do so, he randomly selected a number from 1 to 25, obtaining the number 18. He included in the sample the 18th client on the list and every 25th client thereafter. List the numbers that correspond to the 20 clients selected.
Choose the correct answer below.
- 20, 45, …, 500
- 18, 43, …, 493
- 18, 43, …, 498
- 25, 43, …,
24. What does it mean when a part of the population is under-represented?
Choose the correct answer below.
- A part of the population is under-represented when it is proportionally smaller in a sample than in its population.
- A part of the population is under-represented when it is proportionally smaller in its population than in a sample.
- A part of the population is under-represented when individuals selected to be in the sample who do not respond to the survey have different opinions from those who do.
- A part of the population is under-represented when their answers on a survey tend not to reflect their true feelings.
25. Distinguish between nonsampling error and sampling error. Choose the correct answer below.
- Nonsampling error is the error that results because a sample is being used to estimate information about a population. Sampling error is the error that results from undercoverage, nonresponse bias, response bias, or data-entry errors.
- Nonsampling error is the error that results from the process of obtaining the data. Sampling error is the error that results from undercoverage, nonresponse bias, response bias, or data-entry errors.
- Nonsampling error is the error that results from undercoverage, nonresponse bias, response bias, or data-entry errors. Sampling error is the error that results because a sample is being used to estimate information about a population.
- Nonsampling error is the error that results from randomness. Sampling error is the error that results from using a sample to estimate information about a population.
26. The owner of a shopping mall wishes to expand the number of shops available in the food court. He has a market researcher survey the first 100 customers who come into the food court during weekday afternoons to determine what types of food the shoppers would like to see added to the food court. Complete parts (a) and (b) below.
(a) The survey has bias. Determine whether the flaw is due to the sampling method or the survey itself. For biased surveys, identify the cause of the error.
What is the cause of the bias?
- Nonresponse
- Response bias
- Sampling bias
(b) Suggest a remedy to the problem.
Which of the following is the best way to remedy this problem?
- Increase the sample size so that more people respond to the question.
- Ask customers throughout the day on both weekdays and weekends.
- Reword the question so that it is balanced.
27. The survey has bias. (a) Determine the type of bias. (b) Suggest a remedy. An anti-war advocate wants to estimate the percentage of people who favor cutting back of funds for the military. She conducts a nationwide survey of 1500 randomly selected adults 18 years and older. The interviewer asks the respondents, ”Do you favor supporting peace by limiting our military involvement in world affairs?”
(a) Which of these best describes the bias in the survey?
- Undercoverage bias
- Sampling bias
- Nonresponse bias
- Response bias
(b) How can the bias be remedied?
- The interviewer should survey a greater number of adults 18 and older.
- The interviewer should reword the question.
- The interviewer should survey people by phone and in person.
- The interviewer should survey people under 18 as well.
or chat with our tutors