
Navigation » List of Schools, Subjects, and Courses » Math 136 – Introduction to Statistics » Homeworks » Section 3.1 Homework
No Answers We dont have answer to this question yet. If you need help with your homework send us an email  or chat with our tutors
Section 3.1 Homework
Section 3.1 Homework
1. The U.S. Department of Housing and Urban Development (HUD) uses the median to report the average price of a home in the United States. Why do you think HUD uses the median? Choose the correct answer below.
- HUD uses the median because the data are skewed right.
- HUD uses the median because the data are bimodal.
- HUD uses the median because the data are skewed left.
- HUD uses the median because the data are symmetrical.
2. True or False: A data set will always have exactly one mode.
Choose the correct answer below.
- True
- False
3. Find the population mean or sample mean as indicated. Sample: 19, 10, 6, 3, 22
Select the correct choice below and fill in the answer box to complete your choice.
4. Find the population mean or sample mean as indicated. Sample: 20, 9, 1, 13, 22
Select the correct choice below and fill in the answer box to complete your choice.
5. The median for the given set of six ordered data values is 27.5.
7 12 21 _ 41 5. What is the missing value?
The missing value is ____
6 The following data represent the amount of time (in minutes) a random sample of eight students took to complete the online portion of an exam in a particular statistics course. Compute the mean, median, and mode time.
66.1, 73.7, 82.6, 105.8, 128.4, 98.9, 94.7, 125.4
Compute the mean exam time. Select the correct choice below and, if necessary, fill in the answer box to complete your choice.
- The mean exam time is _____ (Round to two decimal places as needed.)
- The mean does not exist.
Compute the median exam time. Select the correct choice below and, if necessary, fill in the answer box to complete your choice.
- The median exam time is _____
- The median does not exist.
Compute the mode exam time. Select the correct choice below and, if necessary, fill in the answer box to complete your choice.
- The mode is _____ (Round to two decimal places as needed. Use a comma to separate answers as needed.)
- The mode does not exist.
7. The following data represent the amount of time (in minutes) a random sample of eight students took to complete the online portion of an exam in a particular statistics course. Compute the mean, median, and mode time.
61.9, 74.4, 90.3, 111.1, 128.4, 97.7, 94.7, 119.9
Compute the mean exam time. Select the correct choice below and, if necessary, fill in the answer box to complete your choice.
- The mean exam time is _____ (Round to two decimal places as needed.)
- The mean does not exist.
Compute the median exam time. Select the correct choice below and, if necessary, fill in the answer box to complete your choice.
- The median exam time is _____ (Round to two decimal places as needed.)
- The median does not exist.
Compute the mode exam time. Select the correct choice below and, if necessary, fill in the answer box to complete your choice.
- The mode is ____ (Round to two decimal places as needed. Use a comma to separate answers as needed.)
- The mode does not exist.
8. The following data represent the pulse rates (beats per minute) of nine students enrolled in a statistics course. Treat the nine students as a population. Complete parts (a) through (c).
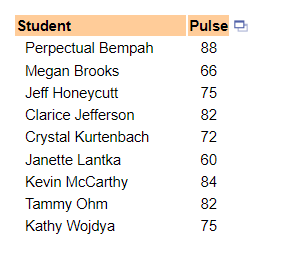
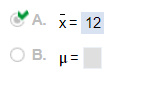
(a) Determine the population mean pulse.
The population mean pulse is approximately ____beats per minute. (Round to one decimal place as needed.)
(b) Determine the sample mean pulse of the following two simple random samples of size 3.
Sample 1: {Kathy, Tammy, Clarice}
Sample 2: {Kevin, Perpectual, Clarice}
The mean pulse of sample 1 is approximately ____ beats per minute. (Round to one decimal place as needed.)
The mean pulse of sample 2, is approximately ___ beats per minute. (Round to one decimal place as needed.)
(c) Determine if the means of samples 1 and 2 overestimate, underestimate, or are equal to the population mean.
The mean pulse rate of sample 1 _____ the population mean.
The mean pulse rate of sample 2 ______ the population mean.
9. The following data represent the pulse rates (beats per minute) of nine students enrolled in a statistics course. Treat the nine students as a population. Complete parts (a) to (c).
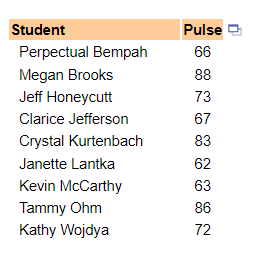
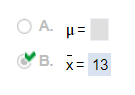
(a) Determine the population mean pulse.
The population mean pulse is approximately ____beats per minute. (Type an integer or decimal rounded to the nearest tenth as needed.)
(b) Determine the sample mean pulse of the following two simple random samples of size 3.
Sample 1: {Perpectual, Tammy, Kevin}
Sample 2: {Megan, Perpectual, Kathy}
The mean pulse of sample 1 is approximately ____ beats per minute. (Round to the nearest tenth as needed.)
The mean pulse of sample 2, is approximately ____ beats per minute. (Round to the nearest tenth as needed.)
(c) Determine if the means of samples 1 and 2 overestimate, underestimate, or are equal to the population mean.
The mean pulse rate of sample 1 ______ the population mean.
The mean pulse rate of sample 2 _____ the population mean.
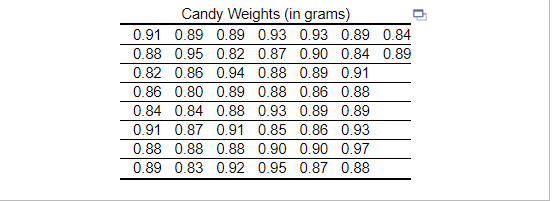
10. The following data represent the weights (in grams) of a simple random sample of a candy.
![]()
Determine the shape of the distribution of weights of the candies by drawing a frequency histogram and computing the mean and the median. Which measure of central tendency best describes the weight of the candy?
Choose the correct frequency histogram below.
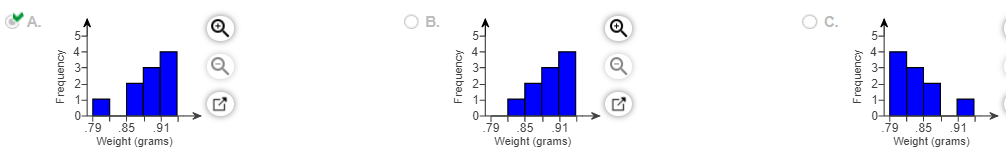
Is the histogram for the data set skewed right, skewed left, or symmetric?
- skewed left
- skewed right
- symmetric
The mean weight of the candies is ____ grams. (Type an integer or decimal rounded to the nearest thousandth as needed.)
The median weight of the candies is _____ grams. (Type an integer or decimal rounded to the nearest thousandth as needed.)
Which measure of central tendency best describes the weight of the candy?
- median
- mode
- mean
11. The accompanying data represent the weights (in grams) of a simple random sample of 50 candies. Determine the shape of the distribution of weights of the candies by drawing a frequency histogram. Find the mean and median. Which measure of central tendency better describes the weight of the candy?
Choose the correct histogram below.
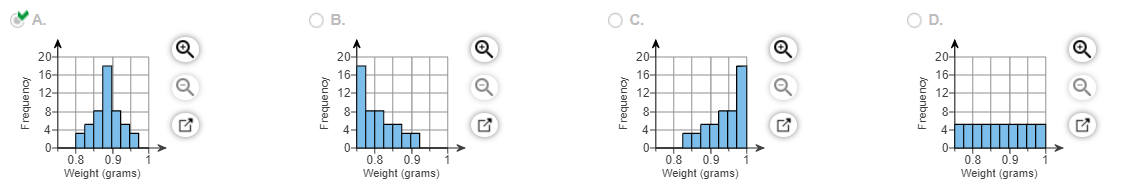
Which measure of central tendency better describes the weight of the candy?
The mean weight is ____ grams and the median weight is grams.
The distribution is _____ so the is the better measure of central tendency.
(Type integers or decimals rounded to three decimal places as needed.)
12. A sample of 20 registered voters was surveyed in which the respondents were asked, “Do you think Chang, Johnson, Ohm, or Smith is most qualified to be a senator?” The results of the survey are shown in the table.
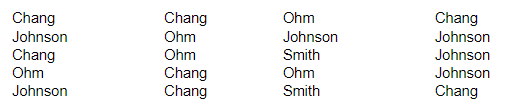
(a) Determine the mode candidate.
- Chang
- Smith
- Ohm
- Johnson
(b) Do you think it would be a good idea to rotate the candidate choices in the question? Why?
- Yes, to confuse the respondents
- Yes, to make the resulting counts all closer to each other
- Yes, to avoid response bias
- There is no need to rotate the choices.
13. Each of the following three data sets represents the IQ scores of a random sample of adults. IQ scores are known to have a mean and median of 100.
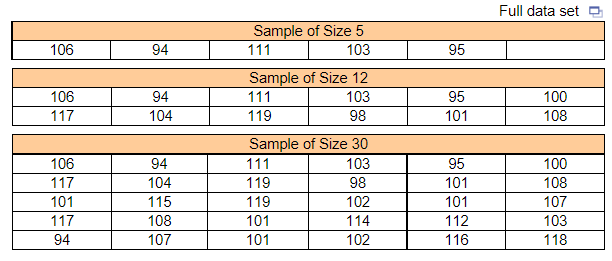
For each data set, compute the mean and median.
What is the mean of the sample of size 5? ____ (Type an integer or decimal rounded to one decimal place as needed.)
What is the mean of the sample of size 12? _____ (Type an integer or decimal rounded to one decimal place as needed.)
What is the mean of the sample of size 30? _____ (Type an integer or decimal rounded to one decimal place as needed.)
What is the median of the sample of size 5? _____ (Type an integer or decimal rounded to one decimal place as needed.)
What is the median of the sample of size 12? _____ (Type an integer or decimal rounded to one decimal place as needed.)
What is the median of the sample of size 30? ______ (Type an integer or decimal rounded to one decimal place as needed.)
For each data set recalculate the mean and median, assuming that the individual whose IQ is 106 is accidently recorded as 160.
What is the mean of the new sample of size 5? ____ (Type an integer or decimal rounded to one decimal place as needed.)
What is the mean of the new sample of size 12? ____ (Type an integer or decimal rounded to one decimal place as needed.)
What is the mean of the new sample of size 30? ____(Type an integer or decimal rounded to one decimal place as needed.)
What is the median of the new sample of size 5? _____ (Type an integer or decimal rounded to one decimal place as needed.)
What is the median of the new sample of size 12? _____ (Type an integer or decimal rounded to one decimal place as needed.)
What is the median of the new sample of size 30? _____ (Type an integer or decimal rounded to one decimal place as needed.)
For each sample size, state what happens to the mean and median.
For each sample size, the mean ______, and the median _________________.
Comment on the role that the number of observations plays in resistance.
- As the sample size increases, the impact of the misrecorded data on the mean increases.
- As the sample size increases, the impact of the misrecorded data on the mean remains the same.
- As the sample size increases, the impact of the misrecorded data on the mean decreases.
14. Mr. Zuro finds the mean height of all 16 students in his statistics class to be 69.0 inches. Just as Mr. Zuro finishes explaining how to get the mean, Danielle walks in late. Danielle is 67.3 inches tall. What is the mean height of the 17 students in the class? The mean height of the 17 students in the class is ______ inches.
15. Benjamin owns a small Internet business. Besides himself, he employs nine other people. The salaries earned by the employees are given below in thousands of dollars (Benjamin’s salary is the largest, of course). Complete parts (a) through (d).
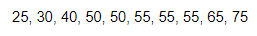
(a) Determine the mean, median, and mode for salary.
The mean salary is ______thousand dollars. (Type an integer or a decimal.)
The median salary is _____thousand dollars. (Type an integer or a decimal.)
Select the correct choice below and fill in any answer boxes in your choice.
- The mode salary is _____ thousand dollars. (Type an integer or a decimal. Use a comma to separate answers as needed.)
- There is no mode.
(b) Business has been good! As a result, Benjamin has a total of $25,000 in bonus pay to distribute to his employees. One option for distributing bonuses is to give each employee (including himself) $2,500. Add the bonuses under this plan to the original salaries to create a new data set. Recalculate the mean, median, and mode. How do they compare to the originals?
The mean for the new data set is _____ thousand dollars. (Type an integer or a decimal.)
The median salary for a new data set is ______thousand dollars. (Type an integer or a decimal.)
Select the correct choice below and fill in any answer boxes in your choice.
- The mode salary for the new data set is ______thousand dollars. (Type an integer or a decimal. Use a comma to separate answers as needed.)
- There is no mode.
How do the mean, median, and mode compare to the originals?
- All three measures increased by $2,500.
- All three measures increased by 10%.
- The mean increased by $2,500, but the median and the mode did not change.
- The mean, median, and mode did not change.
(c) As a second option, Benjamin can give each employee a bonus of 5% of his or her original salary. Add the bonuses under this second plan to the original salaries to create a new data set. Recalculate the mean, median, and mode. How do they compare to the originals?
The mean for the new data set is ______ thousand dollars. (Type an integer or a decimal.)
The median salary for the new data set is ______ thousand dollars. (Type an integer or a decimal.)
Select the correct choice below and fill in any answer boxes in your choice.
- The mode salary for the new data set is _____ thousand dollars. (Type an integer or a decimal. Use a comma to separate answers as needed.)
- There is no mode.
How do the mean, median, and mode compare to the originals?
- The mean increased by $2,500, but the median and the mode did not change.
- All three measures increased by 5%.
- The mean, median, and mode did not change.
- The mean increased by 10%, but the median and the mode did not change.
(d) As a third option, Benjamin decides not to give his employees a bonus at all. Instead, he keeps the $25,000 for himself. Use this plan to create a new data set. Recalculate the mean, median, and mode. How do they compare to the originals?
The mean for the new data set is ____________ thousand dollars. (Type an integer or a decimal.)
The median salary for the new data set is ______ thousand dollars. (Type an integer or a decimal.)
Select the correct choice below and fill in any answer boxes in your choice.
- The mode salary for the new data set is _______thousand dollars. (Type an integer or a decimal. Use a comma to separate answers as needed.)
- There is no mode.
How do the mean, median, and mode compare to the originals?
- The mean, median, and mode did not change.
- The mean increased by $2,500, but the median and the mode did not change.
- All three measures increased by $2,500.
- All three measures increased by 10%.
16.
Another measure of central tendency is the trimmed mean. It is computed by determining the mean of a data set after deleting the smallest and largest observed values. Compute the trimmed mean for the data given in the accompanying table, whose mean is 0.875. Is the trimmed mean resistant?
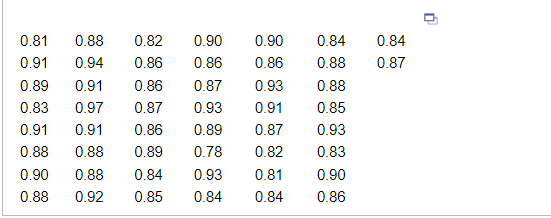
The trimmed mean is _____ (Round to the nearest thousandth as needed.)
Is the trimmed mean resistant?
- Yes, because extreme values affect it substantially.
- No, because extreme values affect it substantially.
- Yes, because extreme values do not affect it.
- No, because extreme values do not affect it.
17. Why is the median resistant, but the mean is not? Choose the correct answer below.
- The median is resistant, while the mean is not, because when there are extreme values in the tail, the value of the median changes while the mean does not.
- The mean is not resistant because when data are skewed, there are extreme values in the tail, which tend to pull the mean in the direction of the tail. The median is resistant because the median of a variable is the value that lies in the middle of the data when arranged in ascending order and does not depend on the extreme values of the data.
- The mean is not resistant because it is dependent upon the sample size, n. The larger n is, the smaller the mean becomes. However, the median is resistant because it is not dependent on the sample size, n.
- The mean is not resistant because when data are skewed, there are extreme values in the tail, which do not pull the mean in that direction. However, the median is pulled in the direction of the extreme values, making it resistant.
18. In 1994, major league baseball players went on strike. At the time, the average salary was $1,049,589, and the median salary was $337,500. If you were representing the owners, which summary would you use to convince the public that a strike was not needed? If you were a player, which would you use? Why was there such a large discrepancy between the mean and median salaries? Explain.
Select the correct answers below.
If you were representing the owners, you would use the ______ to convince the public that a strike was not needed. If you were a player, you would use the ________ to convince the public that a strike was needed. The average and median salaries differ so greatly because ________
19. For the distribution shown, which letter represents the mode?
A right tailed distribution curve is over a horizontal axis. Vertical line segments extend from the horizontal axis to the curve at A, B, and C, where A is at the peak of the curve, B is to the right of A and C is to the right of B. The vertical line at B roughly divides the area under the curve into two equal parts.
(This is a reading assessment question. Be certain of your answer because you only get one attempt on this question.)
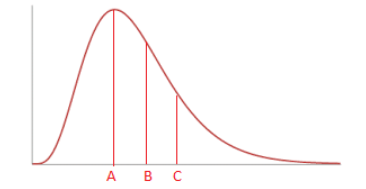
The letter ____ represents the mode.
or chat with our tutors