
Navigation » List of Schools, Subjects, and Courses » Math 136 – Introduction to Statistics » Homeworks » Section 3.2 Homework
No Answers We dont have answer to this question yet. If you need help with your homework send us an email  or chat with our tutors
Section 3.2 Homework
Section 3.2 Homework
1. Complete the paragraph below.
The standard deviation is used in conjunction with the ______ to numerically describe distributions that are bell shaped. The ______ measures the center of the distribution, while the standard deviation measures the ______ of the distribution.
Choose the correct answers below.
The standard deviation is used in conjunction with the _____ to numerically describe distributions that are bell shaped. The _____ measures the center of the distribution, while the standard deviation measures the _____ of the distribution.
2 True or False: When comparing two populations, the larger the standard deviation, the more dispersion the distribution has, provided that the variable of interest from the two populations has the same unit of measure.
Choose the correct answer below.
- True, because the standard deviation is the difference between the largest and smallest observation. When the standard deviation is larger, there is more distance between the largest and smallest observation, and therefore, more dispersion in the distribution.
- False, because the standard deviation measures the spread of the distribution, not the dispersion of the distribution.
- False, because the larger the standard deviation is, the less dispersion the distribution has.
- True, because the standard deviation describes how far, on average, each observation is from the typical value. A larger standard deviation means that observations are more distant from the typical value, and therefore, more dispersed.
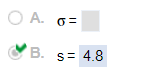
3. Find the sample variance and standard deviation. 19, 10, 6, 9, 11
Choose the correct answer below. Fill in the answer box to complete your choice. (Type an integer or a decimal. Round to one decimal place as needed.)
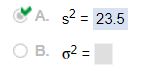
Choose the correct answer below. Fill in the answer box to complete your choice.(Round to one decimal place as needed.)
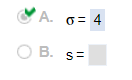
4. Find the population variance and standard deviation. 8, 11, 15, 17, 19
Choose the correct answer below. Fill in the answer box to complete your choice. (Type an integer or a decimal. Do not round.)
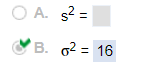
Choose the correct answer below. Fill in the answer box to complete your choice. (Type an integer or a decimal. Do not round.)
5. The following data represent the flight time (in minutes) of a random sample of seven flights from one city to another city. 283, 269, 259, 265, 256, 262, 268
Compute the range and sample standard deviation of flight time.
The range of flight time is _____ minutes.
The sample standard deviation of flight time is ____ minutes.
(Type an integer or decimal rounded to one decimal place as needed.)
6. The following data represent exam scores in a statistics class taught using traditional lecture and a class taught using a “flipped” classroom. Complete parts (a) through (c) below.
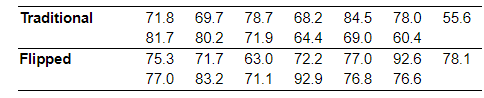
(a) Which course has more dispersion in exam scores using the range as the measure of dispersion?
The traditional course has a range of ______ while the “flipped” course has a range of ______. The ______ course has more dispersion. (Type integers or decimals. Do not round.)
(b) Which course has more dispersion in exam scores using the sample standard deviation as the measure of dispersion?
The traditional course has a standard deviation of ______ while the “flipped” course has a standard deviation of _____. The _____ course has more dispersion. (Round to three decimal places as needed.)
(c) Suppose the score of 60.4 in the traditional course was incorrectly recorded as 604. How does this affect the range?
The range is now _____ (Type an integer or a decimal. Do not round.)
How does this affect the standard deviation?
The standard deviation is now ____ (Round to three decimal places as needed.)
What property does this illustrate?
- Both the range and the standard deviation are resistant.
- The standard deviation is resistant, but the range is not resistant.
- Neither the range nor the standard deviation is resistant.
- The range is resistant, but the standard deviation is not resistant.
7. The weight of an organ in adult males has a bell-shaped distribution with a mean of 340 grams and a standard deviation of 20 grams. Use the empirical rule to determine the following.
(a) About 68% of organs will be between what weights?
(b) What percentage of organs weighs between 300 grams and 380 grams?
(c) What percentage of organs weighs less than 300 grams or more than 380 grams?
(d) What percentage of organs weighs between 280 grams and 380 grams?
(a) ______ and __________ grams (Use ascending order.)
(b) _______ (Type an integer or a decimal.)
(c) ______ (Type an integer or a decimal.)
(d) ________ (Type an integer or decimal rounded to two decimal places as needed.)
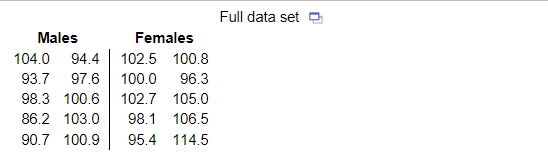
8 Blocking refers to the idea that the variability in a variable can be reduced by segmenting the data by some other variable. The data in the accompanying table represent the recumbent length (in centimeters) of a sample of 10 males and 10 females who are 40 months of age. Complete parts (a) through (d).

(a) Determine the standard deviation of recumbent length for all 20 observations.___ cm (Round to two decimal places as needed.)
(b) Determine the standard deviation of recumbent length for the males. ___ cm (Round to two decimal places as needed.)
(c) Determine the standard deviation of recumbent length for the females. __ cm (Round to two decimal places as needed.)
(d) What effect does blocking by gender have on the standard deviation of recumbent length for each gender?
- The standard deviation for each group is the same as it is for the groups combined.
- The standard deviation is higher for each group than it is for the groups combined.
- The standard deviation is lower for each group than it is for the groups combined.
9. The data set below on the left represents the annual rate of return (in percent) of eight randomly sampled bond mutual funds, and the data set below on the right represents the annual rate of return (in percent) of eight randomly sampled stock mutual funds. Use the information in the table below to complete parts (a) through (d). Then complete part (e).
(a) Determine the mean and standard deviation of each data set.
The mean of the data set for bond mutual funds is ____ (Type an integer or decimal rounded to three decimal places as needed.)
The standard deviation of the data set for bond mutual funds is ____ (Type an integer or decimal rounded to three decimal places as needed.)
The mean of the data set for stock mutual funds is ____ (Type an integer or decimal rounded to three decimal places as needed.)
The standard deviation of the data set for stock mutual funds is ____ (Type an integer or decimal rounded to three decimal places as needed.)
(b) Based only on the standard deviation, _____ have more spread.
(c) What proportion of the bond mutual funds are within one standard deviation of the mean? ____ (Type an integer or decimal rounded to three decimal places as needed.)
10. In a statistics class, the standard deviation of the heights of all students was 3.9 inches. The standard deviation of the heights of males was 3.4 inches and the standard deviation of females was 3.3 inches. Why is the standard deviation of the entire class more than the standard deviation of the males and females considered separately?
Choose the correct answer below.
- The standard deviation of the entire class is more than the standard deviation of the males and females considered separately because the distribution of the entire class has more dispersion.
- The standard deviation of the entire class is more than the standard deviation of the males and females considered separately because the male and female sample sizes are smaller than the sample of the entire class.
- The standard deviation of the entire class is more than the standard deviation of the males and females considered separately because there is more dispersion in the male and female samples than the entire class.
- The standard deviation of the entire class is more than the standard deviation of the males and females considered separately because the smaller the sample, the smaller the sample standard deviation.
11. If a variable has a distribution that is bell-shaped with mean 29 and standard deviation 6, then according to the Empirical Rule, 95.0% of the data will lie between which values?
(This is a reading assessment question. Be certain of your answer because you only get one attempt on this question.)
According to the Empirical Rule, 95.0% of the data will lie between ________ and _________
or chat with our tutors