
Navigation » List of Schools, Subjects, and Courses » Math 227 – Statistics » Quizzes » Section 2.2 Homework
No Answers We dont have answer to this question yet. If you need help with your homework send us an email  or chat with our tutors
Section 2.2 Homework
Section 2.2 Homework
1. _________ are the categories by which data are grouped.
2. Select the correct choices that complete the sentence below.
The ______ class limit is the smallest value within the class and the ______ class limit is the largest value within the class.
3. The _________________ is the difference between consecutive lower class limits.
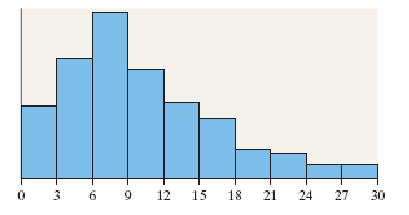
4. Determine whether the following statement is true or false. The shape of the distribution shown is best classified as skewed left
Choose the correct answer below.
- False
- True
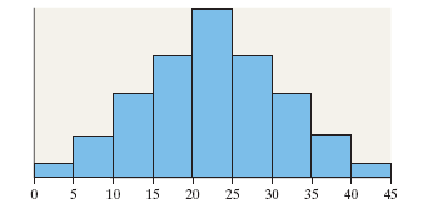
5. Determine whether the following statement is true or false. The shape of the distribution shown is best classified as uniform.
Choose the correct answer below.
False
True
6. An experiment was conducted in which two fair dice were thrown 100 times. The sum of the pips showing on the dice was then recorded. The frequency histogram to the right gives the results. Use the histogram to complete parts (a) through (f).
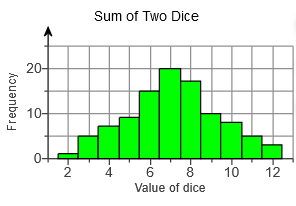
(a) What was the most frequent outcome of the experiment?
(b) What was the least frequent?
(c) How many times did we observe a 9?
(d) How many more 10’s were observed than 11’s?
(e) Determine the percentage of time a 9 was observed ____ %
(f) Describe the shape of the distribution. Choose the correct answer below.
- Skewed left
- Skewed right
- Uniform
- Bell dash shaped
7. The following frequency histogram represents the IQ scores of a random sample of seventh-grade students. IQs are measured to the nearest whole number. The frequency of each class is labeled above each rectangle. Use the histogram to answers parts (a) through (g).
(a) How many students were sampled? ____ students
(b) Determine the class width. The class width is ____.
(c) Identify the classes and their frequencies. Choose the correct answer below.
- 65, 1; 75, 4; 85, 12; 95, 49; 105, 46; 115, 44; 125, 31; 135, 9; 145, 2; 155, 2
- 60-70, 1; 70-80, 4; 80-90, 12; 90-00, 49; 100-110, 46; 110-120, 44; 120-130, 31 ;130-140, 9; 140-150, 2; 150-160, 2
- 60-69, 1; 70-79, 4; 80-89, 12; 90-99, 49; 100-109, 46; 110-119, 44; 120-129, 31 ;130-139, 9; 140-149, 2; 150-159, 2
(d) Which class has the highest frequency?
- 90 dash 100
- 100 dash 109
- 95
- 90 dash 99
(e) Which class has the lowest frequency?
- 150 dash 159
- 60 dash 70
- 60 dash 69
- 65
(f) What percent of students had an IQ of at least 120? ____% (Type an integer or a decimal. Do not round.)
(g) Did any students have an IQ of 164?
- Yes, because there is a bar in the 150-159 class.
- No, because there is a bar in the 150-159 class.
- Yes, because there is a frequency of a score of 165.
- No, because there are no bars, or frequencies, greater than an IQ of 160.
8. For jewelry prices in a jewelry store, state whether you would expect a histogram of the data to be bell-shaped, uniform, skewed left, or skewed right.
Choose the correct answer below.
- Uniform
- Skewed right
- Skewed Left
- Bell shaped
9. To predict future enrollment in a school district, fifty households within the district were sampled, and asked to disclose the number of children under the age of five living in the household. The results of the survey are presented in the table. Complete parts (a) through (c) below.
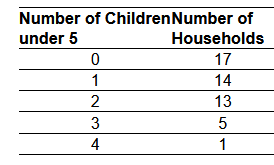
(a) Construct a relative frequency distribution of the data.
| Number of Children under 5 | Number of Households |
| 0 | |
| 1 | |
| 2 | |
| 3 | |
| 4 |
(b) What percentage of households has two children under the age of 5? __% (Type an integer or a decimal. Do not round.)
(c) What percentage of households has one or two children under the age of 5? ___ % (Type an integer or a decimal. Do not round.)
10. Determine the original set of data.
The original set of data is _______
11. The data to the right represent the top speed (in kilometers per hour) of all the players (except goaltenders) in a certain soccer league. Find (a) the number of classes, (b) the class limits for the First class, and (c) the class width.
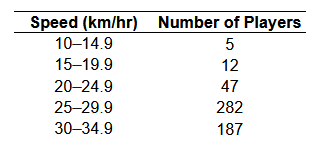
(a) There are ____ classes. (Type a whole number.)
(b) The lower class limit for the first class is ______. (Type an integer or a decimal. Do not round.)
The upper class limit for the first class is ___. (Type an integer or a decimal. Do not round.)
(c) The class width is ___.. (Type an integer or a decimal. Do not round.)
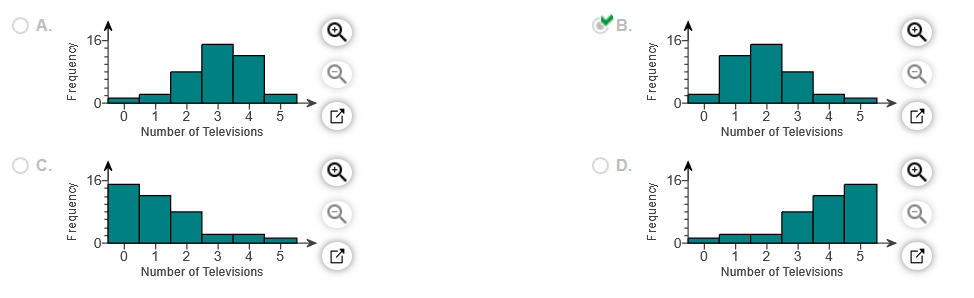
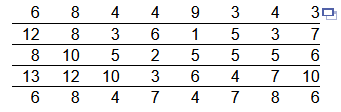
12. A researcher wanted to determine the number of televisions in households. He conducts a survey of 40 randomly selected households and obtains the data in the accompanying table. Complete parts (a) through (h) below.
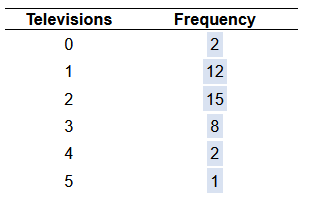
(a) Are these data discrete or continuous? Explain.
The given data are continuous because they can take on any real value.
The given data are discrete because they can take on any real value.
The given data are continuous because they can only have whole number values.
The given data are discrete because they can only have whole number values.
(b) Construct a frequency distribution of the data.
| Televisions | Frequency |
| 0 | |
| 1 | |
| 2 | |
| 3 | |
| 4 | |
| 5 |
(c) Construct a relative frequency distribution of the data.
| Televisions | Frequency |
| 0 | |
| 1 | |
| 2 | |
| 3 | |
| 4 | |
| 5 |
(d) What percentage of households in the survey have three televisions? ___ % (Type an integer or a decimal. Do not round.)
(e) What percentage of households in the survey have four or more televisions? ___ % (Type an integer or a decimal. Do not round.)
(f) Construct a frequency histogram of the data. Choose the correct graph below.
(g) Construct a relative frequency histogram of the data. Choose the correct graph below.

(h) Describe the shape of the distribution.
The distribution is _____
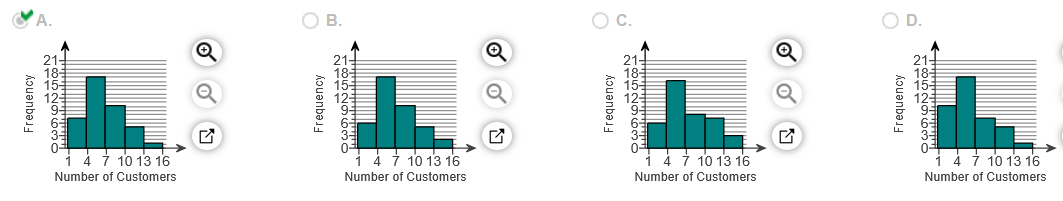
13. The data to the right represent the number of customers waiting for a table at 6:00 P.M. for 40 consecutive Saturdays at Bobak’s Restaurant. Complete parts (a) through (h) below.
(a) Are these data discrete or continuous? Explain.
The data are continuous because it was recorded for 40 consecutive Saturdays.
The data are discrete because there are a finite or countable number of values.
The data are continuous because there are a finite or countable number of values.
The data are discrete because it was recorded for 40 consecutive Saturdays.
(b) Construct a frequency distribution of the data.
| Number of Customers | Frequency |
| 1-3 | |
| 4-6 | |
| 7-9 | |
| 10-12 | |
| 13-15 |
(c) Construct a relative frequency distribution of the data.
| Number of Customers | Frequency |
| 1-3 | |
| 4-6 | |
| 7-9 | |
| 10-12 | |
| 13-15 |
(d) What percentage of the Saturdays had 4or more customers waiting for a table at 6:00 P.M.? ___% (Type an integer or a decimal. Do not round.)
(e) What percentage of the Saturdays had 6or fewer customers waiting for a table at 6:00 P.M.? ____ % (Type an integer or a decimal. Do not round.)
(f) Construct a frequency histogram of the data. Choose the correct histogram below.

(g) Construct a relative frequency histogram of the data. Choose the correct histogram below.
(h) Describe the shape of the distribution. Choose the correct answer below.
- The distribution is skewed left because the left tail is longer than the right tail.
- The distribution is skewed right because the right tail is longer than the left tail.
- The distribution is skewed right because the left tail is longer than the right tail.
- The distribution is symmetric because the bars in the histograms are all approximately the same height.
- The distribution is symmetric because the left and right sides are approximatelymirror images
- The distribution is skewed left because the right tail is longer than the left tail.
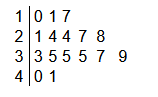
14. The data in the accompanying table represent the ages of the presidents of a country on their first days in office. Complete parts (a) and (b).
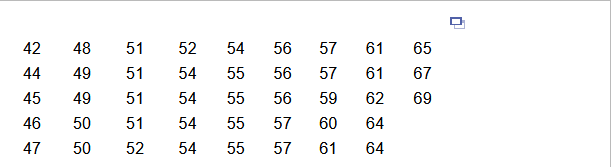
a) Construct a stem-and-leaf Choose the correct answer below.
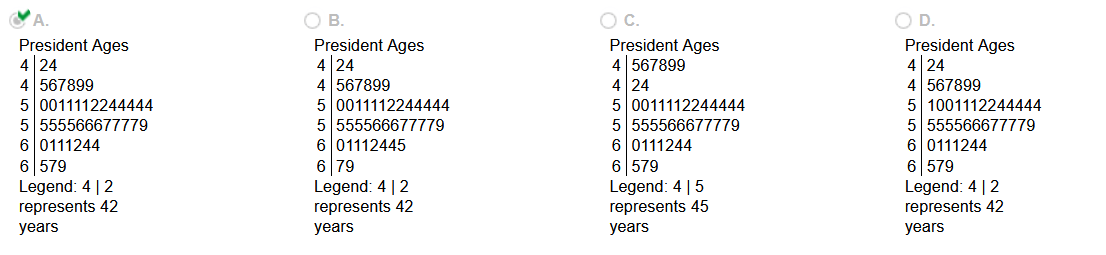
(b) Describe the shape of the distribution. Choose the correct answer below.
- Uniform
- Skewed left
- Bell shaped
- Skewed right
15 Why shouldn’t classes overlap when summarizing continuous data in a frequency or relative frequency distribution?
Choose the correct answer below.
- Classes shouldn’t overlap so that the distribution is not skewed in one direction.
- Classes shouldn’t overlap so that the class width is as small as possible.
- Classes shouldn’t overlap so there is no confusion as to which class an observation belongs.
- Classes shouldn’t overlap so that they are open ended.
16. What is wrong with the following class limits for organizing weight data for a sample of 200 adult men in the United States?
140-150 pounds
150-160 pounds
160-170 pounds
170-180 pounds
180-190 pounds
190-200 pounds
200-210 pounds
210-220 pounds
220-230 pounds
Choose the correct answer below.
- The class width should be larger than 10 pounds.
- The classes are overlapping.
- The class width should be smaller than 10 pounds.
- There are too many classes.
17. True or false? A histogram and a relative frequency histogram, constructed from the same data, always have the same basic shape.
Choose the correct answer below.
- False. The histograms use different scales on the y-axis, resulting in completely different shapes.
- True. A relative frequency histogram will have a different scale on the y-axis but the same shape as a regular histogram.
- False. The two histograms can have very different shapes depending on the distribution of the data.
- True. They will both have the same shape and the same vertical scale. They will differ only in the scale used on the horizontal axis.
18. Which information can you obtain from a stem-and-leaf plot but not from a histogram?
Choose the correct answer below.
- Center of the data
- Minimum and maximum data values
- Presence of outliers
- Shape of the distribution
or chat with our tutors