
Navigation » List of Schools, Subjects, and Courses » Math 227 – Statistics » Quizzes » Section 2.1 and 2.3 Homework
No Answers We dont have answer to this question yet. If you need help with your homework send us an email  or chat with our tutors
Section 2.1 and 2.3 Homework
Section 2.1 and 2.3 Homework
1. A frequency distribution lists the _______ of occurrences of each category of data, while a relative frequency distribution lists the ______of occurrences of each category of data.
2. In a relative frequency distribution, what should the relative frequencies add up to? Select the correct choice and, if necessary, fill in the answer box to complete your choice.
- The relative frequencies add up to ___
- The relative frequencies add up to the total number of observations.
3. What is a bar graph? What is a Pareto chart?
What is a bar graph?
- A bar graph represents the frequencies of values either from left-to-right or right-to-left. The different segments of the bar are used to indicate the different frequencies of each category.
- A bar graph is a horizontal or vertical representation of the frequency or relative frequency of the categories. The height of each rectangle represents the category’s frequency or relative frequency.
- A bar graph is a circular graph that uses bars to divide it into segments corresponding to each category. The segments are proportional to the frequency of its category.
What is a Pareto chart?
- A Pareto chart is a bar graph whose bars are drawn in decreasing order of frequency or relative frequency.
- A Pareto chart is a display of two data sets side by side where the height of each rectangle represents the category’s frequency or relative frequency.
- A Pareto chart is a combination of a pie chart and a bar graph.
4. The following graph represents the results of a survey, in which a random sample of adults in a certain country was asked if a certain action was morally wrong in general. Complete parts (a) through (c) below.
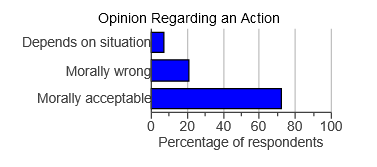
(a) What percent of the respondents believe the action is morally acceptable?
About ____ % of the respondents (Round to the nearest whole number as needed.)
(b) If there are 296million adults in the country, how many believe that the action is morally wrong?
About ___ million adults (Round to the nearest million as needed.)
(c) If a polling organization claimed that the results of the survey indicate that 7% of adults in the country believe that the action is acceptable in certain situations, would you say this statement is descriptive or inferential? Why?
The statement is _____ because it ______
5. In a poll, a random sample of 2163 adults (aged 18 and over) was asked, “When you see an ad emphasizing that a product is made in your country, are you more likely to buy it, less likely to buy it, or neither more nor less likely to buy it?” The results of the survey are presented in the side-by-side graph. Complete parts (a) through (d) below.
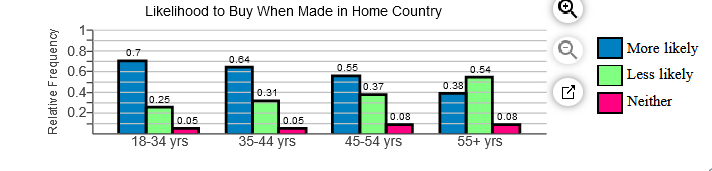
(a) What proportion of 18- to 34-year-old respondents are more likely to buy when made in their country? What proportion of 35- to 44-year-old respondents are more likely to buy when made in their country?
The proportion of 18- to 34-year-old respondents is ___ .
The proportion of 35- to 44-year-old respondents is ____.
(b) What age group has the greatest proportion who are more likely to buy when made in their country?
- 18-34 yrs
- 45-54 yrs
- 55+ yrs
- 35-44 yrs
(c) Which age group has a majority of respondents who are less likely to buy when made in their country?
- 45-54 yrs
- 55 + yrs
- 35-44 yrs
- 18-34 yrs
(d) What is the apparent association between age and likelihood to buy when made in their country?
- As age decreases, likelihood to buy homegrown increases
- As age increases, so does likelihood to buy homegrown.
- There is no apparent association between age and likelihood to buy homegrown.
6. A national survey asked people, “How often do you eat out for dinner, instead of at home?” The frequencies were as follows. Complete parts (a) through (g).
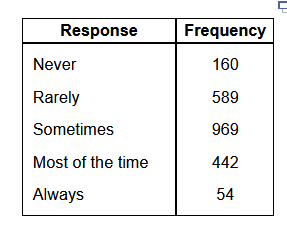
(a) Construct a relative frequency distribution of the data.
| Response | Relative Frequency |
| Never | |
| Rarely | |
| Sometimes | |
| Most of the time | |
| Always |
(b) What percentage of respondents answered “Always”? ___ % (Round to one decimal place as needed.)
(c) What percentage of respondents answered “Never” or “Rarely”? ____ % (Round to one decimal place as needed.)
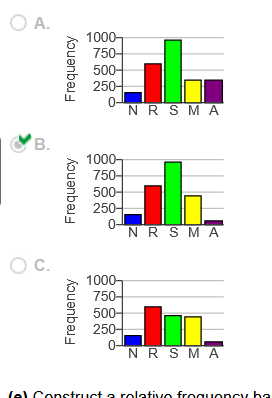
(d) Construct a frequency bar graph. Choose the correct answer below.
(g) Suppose a person claims that, ”2.4 % of all people in the nation always eat out.” Is this a descriptive or inferential statement?
- inferential
- descriptive
7 Suppose a survey was conducted in which participants were asked to disclose their favorite night for a particular activity. The results are summarized in the table. Complete parts (a) through (f) below.
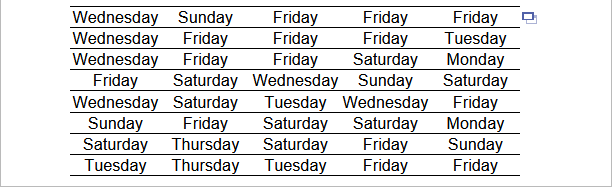
(a) Construct a frequency distribution.
| Day | Frequency |
| Sunday | |
| Monday | |
| Tuesday | |
| Wednesday | |
| Thursday | |
| Friday | |
| Saturday |
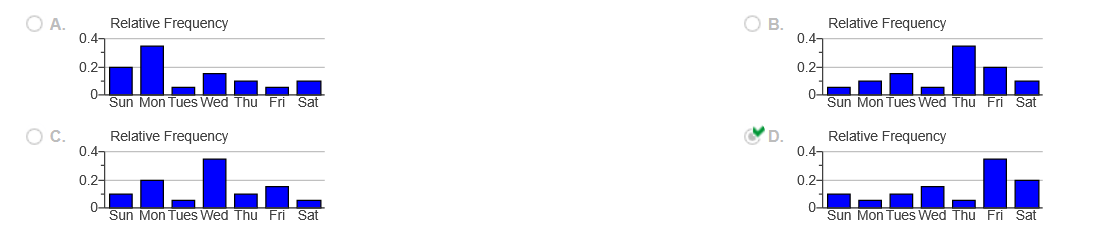
(b) Construct a relative frequency distribution.
| Day | Frequency |
| Sunday | |
| Monday | |
| Tuesday | |
| Wednesday | |
| Thursday | |
| Friday | |
| Saturday |
c) If you own a business that sells products related to the activity, which day would you purchase an advertisement in the local newspaper? Are there any days you would avoid purchasing advertising space?
The best day to purchase advertising would probably be ____
The worst day to purchase advertising would probably be ____
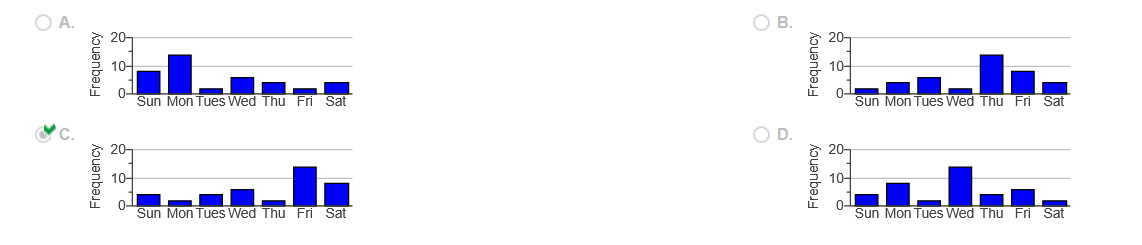
(d) Construct a frequency bar graph. Choose the correct graph below.
8
or chat with our tutors