
Navigation » List of Schools, Subjects, and Courses » Math 227 – Statistics » Quizzes » Chapter 2 Quiz
No Answers We dont have answer to this question yet. If you need help with your homework send us an email  or chat with our tutors
Chapter 2 Quiz
Chapter 2 Quiz
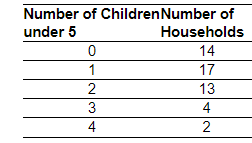
1. To predict future enrollment in a school district, fifty households within the district were sampled, and asked to disclose the number of children under the age of five living in the household. The results of the survey are presented in the table. Complete parts (a) through (c) below.
(a) Construct a relative frequency distribution of the data.
| Number of Children Under 5 | Number of Households |
| 0 | 14 |
| 1 | 17 |
| 2 | 13 |
| 3 | 4 |
| 4 | 2 |
(b) What percentage of households has two children under the age of 5? ____ (Type an integer or a decimal. Do not round.)
(c) What percentage of households has one or two children under the age of 5? ____ (Type an integer or a decimal. Do not round.)
2. Determine whether the following statement is true or false.The shape of the distribution shown is best classified as uniform.
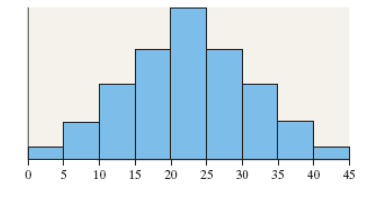
Choose the correct answer below.
- False
- True
3. The safety manager at Bumbler Enterprises provides the graph shown on the right to the plant manager and claims that the rate of worker injuries has been reduced by 50% over a 12-year period. Does the graph support his claim? Explain.
Choose the correct answer below.
- The graph supports his claim. The height of the bar for 2005 is less than or equal to50% of the height of the bar for 1993.
- The graph does not support his claim. The vertical tick marks are too far apart to determine the exact value for the proportions.
- The graph does not support his claim. The vertical scale does not start at 0 which distorts the percent of change.
- The graph does not support his claim. The vertical scale is different for each bar.
4. The following graph represents the results of a survey, in which a random sample of adults in a certain country was asked if a certain action was morally wrong in general. Complete parts (a) through (c) below.
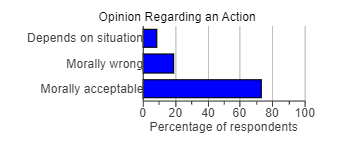
(a) What percent of the respondents believe the action is morally acceptable?
About ____ of the respondents (Round to the nearest whole number as needed.)
(b) If there are 213 million adults in the country, how many believe that the action is morally wrong?
About ____ million adults (Round to the nearest million as needed.)
(c) If a polling organization claimed that the results of the survey indicate that 8%
of adults in the country believe that the action is acceptable in certain situations, would you say this statement is descriptive or inferential? Why?
The statement is _______ because it _____
5. A frequency distribution lists the ______ of occurrences of each category of data, while a relative frequency distribution lists the _____ of occurrences of each category of data.
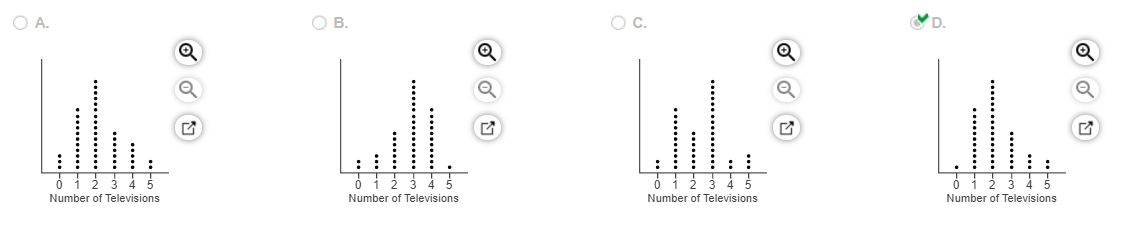
6. A researcher wanted to determine the number of televisions in households. He conducts a survey of 40 randomly selected households and obtained the data to the right. Draw a dot plot of the televisions per household.
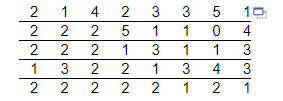
Choose the correct dot plot below.
7. ________ are the categories by which data are grouped.
8. The data in the accompanying table represent the ages of the presidents of a country on their first days in office. Complete parts (a) and (b).
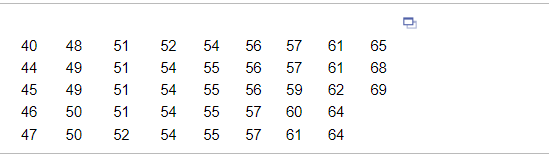
(a) Construct a stem-and-leaf plot. Choose the correct answer below.
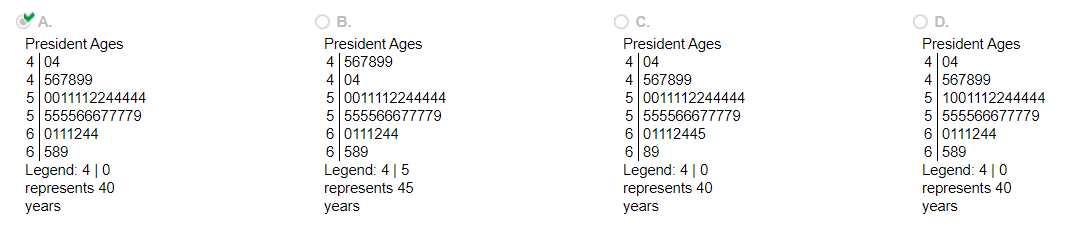
(b) Describe the shape of the distribution. Choose the correct answer below.
- Skewed right
- Skewed left
- Bell shaped
- Uniform
9. Suppose a survey was conducted in which participants were asked to disclose their favorite night for a particular activity. The results are summarized in the table. Complete parts (a) through (f) below.
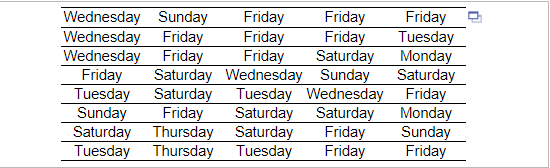
(a) Construct a frequency distribution.
| Day | Frequency |
| Sunday | |
| Monday | |
| Tuesday | |
| Wednesday | |
| Thursday | |
| Friday | |
| Saturday |
(b) Construct a relative frequency distribution.
| Day | Relative Frequency |
| Sunday | |
| Monday | |
| Tuesday | |
| Wednesday | |
| Thursday | |
| Friday | |
| Saturday |
(c) If you own a business that sells products related to the activity, which day would you purchase an advertisement in the local newspaper? Are there any days you would avoid purchasing advertising space?
The best day to purchase advertising would probably be _____
The worst day to purchase advertising would probably be _______
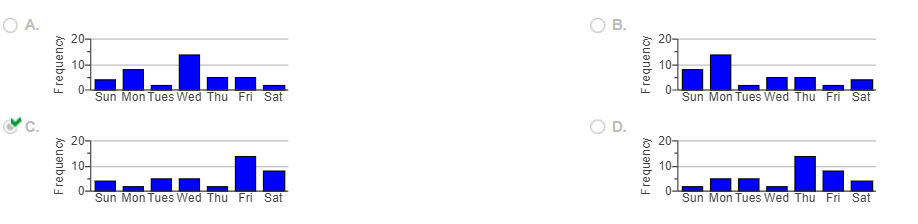
(d) Construct a frequency bar graph. Choose the correct graph below.
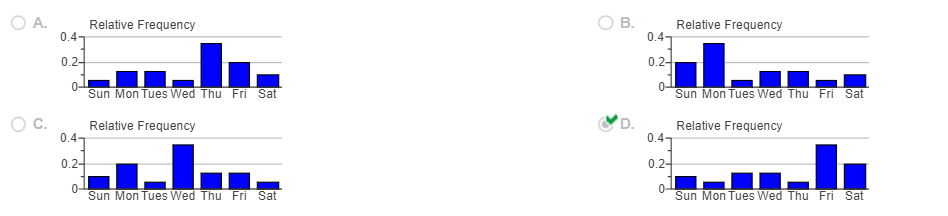
(e) Construct a relative frequency bar graph. Choose the correct graph below.
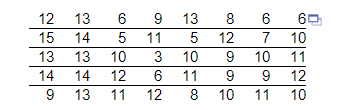
10. The data to the right represent the number of customers waiting for a table at 6:00 P.M. for 40 consecutive Saturdays at Bobak’s Restaurant. Complete parts (a) through (h) below.
(a) Are these data discrete or continuous? Explain.
- The data are continuous because it was recorded for 40 consecutive Saturdays.
- The data are continuous because there are a finite or countable number of values.
- The data are discrete because there are a finite or countable number of values.
- The data are discrete because it was recorded for 40 consecutive Saturdays.
(b) Construct a frequency distribution of the data.
| Number of Customers | Frequency |
| 1-3 | |
| 4-6 | |
| 7-9 | |
| 10-12 | |
| 13-15 |
(c) Construct a relative frequency distribution of the data.
| Number of Customers | Frequency |
| 1-3 | |
| 4-6 | |
| 7-9 | |
| 10-12 | |
| 13-15 |
(d) What percentage of the Saturdays had 7 or more customers waiting for a table at 6:00 P.M.? _____ (Type an integer or a decimal. Do not round.)
(e) What percentage of the Saturdays had 6 or fewer customers waiting for a table at 6:00 P.M.? ______ (Type an integer or a decimal. Do not round.)
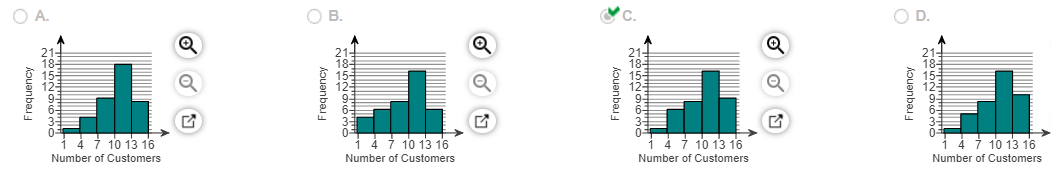
(f) Construct a frequency histogram of the data. Choose the correct histogram below.
(h) Describe the shape of the distribution. Choose the correct answer below.
- The distribution is skewed left because the right tail is longer than the left tail.
- The distribution is skewed right because the left tail is longer than the right tail.
- The distribution is skewed left because the left tail is longer than the right tail.
- The distribution is skewed right because the right tail is longer than the left tail.
- The distribution is symmetric because the bars in the histograms are all approximately the same height.
- The distribution is symmetric because the left and right sides are approximately mirror images.
or chat with our tutors