
Navigation » List of Schools, Subjects, and Courses » Math 120 – Introductory Probability and Statistics » Quizzes » Quiz 4
No Answers We dont have answer to this question yet. If you need help with your homework send us an email  or chat with our tutors
Quiz 4
Quiz 4
1. The accompanying relative frequency ogive represents the composite score on a standardized test for a high school graduating class. Complete parts (a) through (d) below.
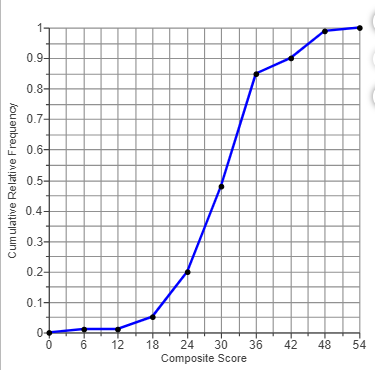
(a) What is the class width? ____ (Type a whole number.)
(b) Approximately 20% of students had a composite score below what level? ____ (Type a whole number.)
(c) What percentage of students had a composite score less than 36? ___ (Type a whole number.)
(d) Ten percent of students had a composite score above what level? _____ (Type a whole number.)
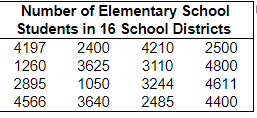
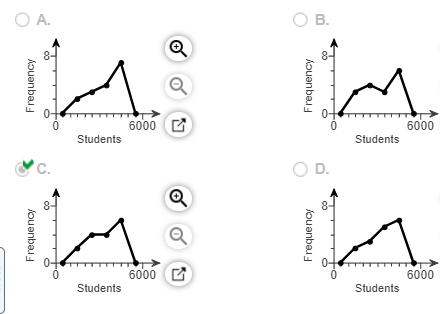
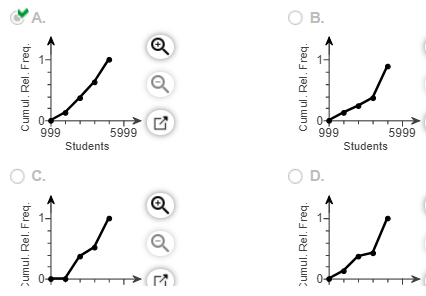
2. The table below gives the number of elementary school children in 16 school districts in a particular region.
(a) Construct a cumulative frequency distribution.
(b) Construct a cumulative relative frequency distribution.
(c) Draw a frequency polygon.
(d) Draw a relative frequency ogive.
(a) Complete the cumulative frequency distribution.
| Students in a District | Cumulative Frequency |
| 1000-1999 | |
| 2000-2999 | |
| 3000-3999 | |
| 4000-4999 |
(b) Complete the cumulative relative frequency distribution.
| Students in a District | Cumulative Relative Frequency |
| 1000-1999 | |
| 2000-2999 | |
| 3000-3999 | |
| 4000-4999 |
(c) Which of these is the frequency polygon?
(d) Which of these is the relative frequency ogive?
3. The following data represent the number of grams of fat in breakfast meals offered at a local fast food restaurant. (a) Construct a stem-and-leaf plot and (b) describe the shape of the distribution.
(a) Construct the stem-and-leaf plot below.
(b) The distribution is _______
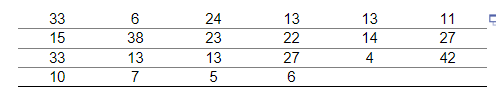
4. The following data represent the ages of award winners for best actor and best actress in a leading role for the 20 years from 1985 to 2004. Answer parts (a)−(b) below.

(a) Construct an ordered back to back stem-and-leaf display.
(b) Compare the two populations. What can you conclude from the back to back stem-and-leaf display?
- Both men and women receive more awards on average as they get older.
- Most men and most women receive awards in their twenties and thirties.
- While most men and most women receive an award in their thirties, men tend to receive the award at a younger age on average than women do.
- While most men and most women receive an award in their thirties, women tend to receive the award at a younger age on average than men do.
5. The following data represent the total federal debt (in trillions of dollars) of the United States from 2000 to 2018. Complete parts (a) and (b) below.
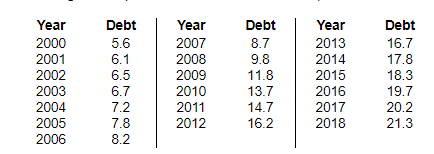
(a) Construct a time-series plot of the data. Choose the correct answer below.
(b) Percentage change may be found using the formula:
What was the percent change in debt from 2008 to 2009? Have there been any years when the debt decreased (since 2000)?
The percent change in debt from 2008 to 2009 was ____ (Round to the nearest tenth as needed.)
Determine whether there have been any years when the debt decreased (since 2000). Select the correct choice below and, if necessary, fill in the answer boxes within your choice.
- Yes, the debt decreased between the year ____ and ____ (Use ascending order.)
- Yes, the debt exclusively decreased over all the years.
- No, the debt generally remained the same over the years.
- No, the debt exclusively increased over all the years.
- There was no discernible trend in the debt over the years.
6.The data in the table represent the tuition for all 2-year community colleges in a region in 2009-2010.
(a) Construct a cumulative frequency distribution.
(b) Construct a cumulative relative frequency distribution.
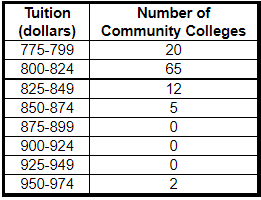
(a) Complete the cumulative frequency distribution.
| Tuition (collars | Cumulative Frequency |
| 775-799 | |
| 800-824 | |
| 825-849 | |
| 850-874 | |
| 875-899 | |
| 900-924 | |
| 925-949 | |
| 950-974 |
(b) Complete the cumulative relative frequency distribution.
| Tuition (collars | Cumulative Relative Frequency |
| 775-799 | |
| 800-824 | |
| 825-849 | |
| 850-874 | |
| 875-899 | |
| 900-924 | |
| 925-949 | |
| 950-974 |
or chat with our tutors