
Navigation » List of Schools, Subjects, and Courses » Math 120 – Introductory Probability and Statistics » Homeworks » Homework 7
No Answers We dont have answer to this question yet. If you need help with your homework send us an email  or chat with our tutors
Homework 7
Homework 7
1. Recently, a random sample of 2534 year olds was asked, “How much do you currently have in savings, not including retirement savings?” The data in the table represent the responses to the survey. Approximate the mean and standard deviation amount of savings.
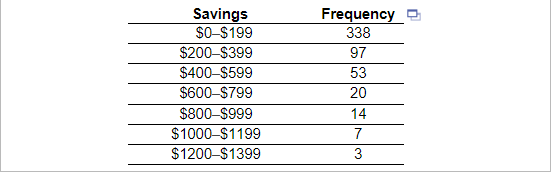
The sample mean amount of savings is ____ (Round to the nearest dollar as needed.)
The sample standard deviation is ______. (Round to the nearest dollar as needed.)
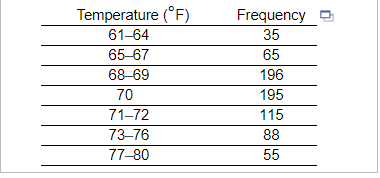
2. Often, frequency distributions are reported using unequal class widths because the frequencies of some groups would otherwise be small or very large. Consider the following data, which represent the daytime household temperature the thermostat is set to when someone is home for a random sample of 749 households. Determine the class midpoint, if necessary, for each class and approximate the mean and standard deviation temperature.
| Class | Class Midpoint |
| 61-64 | |
| 65-67 | |
| 68-69 | |
| 70 | |
| 71-72 | |
| 73-76 | |
| 77-80 |
The sample mean is ____ (Round to one decimal place as needed.)
The sample standard deviation is _____ (Round to one decimal place as needed.)
3. The frequency distribution was obtained using a class width of 0.5 for data on cigarette tax rates. Use the frequency distribution to approximate the population mean and population standard deviation. Compare these results to the actual mean ì=$1.808 and standard deviation ó=$1.186.
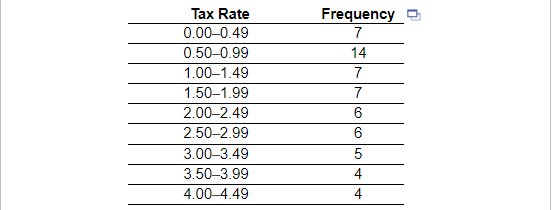
The population mean is _____. (Round to three decimal places as needed.)
The population standard deviation is _____ (Round to three decimal places as needed.)
Compare these results to the values found using the actual data.
- The grouped values are both slightly smaller.
- The grouped mean is slightly smaller, while the grouped standard deviation is slightly larger.
- The grouped mean is slightly larger, while the grouped standard deviation is slightly smaller.
- The grouped values are both slightly larger.
4. Male and female populations of humpback whales under 80 years old are represented by age in the table below. Complete parts (a) through (d).
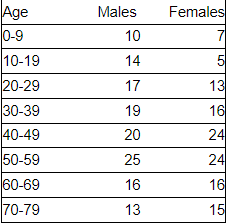
(a) Approximate the population mean and standard deviation of age for males.
(b) Approximate the population mean and standard deviation of age for females.
(c) Which gender has the higher mean age? ______ have the higher mean age.
(d) Which gender has the higher dispersion in age? _____ have the greater dispersion.
5. Suppose the first class in a frequency table of quantitative data is 0-4 and the second class is 5-9.
What is the class midpoint of the first class?
(This is a reading assessment question. Be certain of your answer because you only get one attempt on this question.)
The class midpoint of the first class is ____
6. Patty has just completed her second semester in college. She earned a grade of D in her 3-hour topology course, a grade of B in her 5-hour government course, a grade of C in her 1-hour engineering course, nd a grade of F in her 4-hour creative writing course. Assuming that A equals 4 points, B equals 3 points, C equals 2 points, D equals 1 point, and F is worth no points, determine Patty’s grade-point average for the semester.
Patty’s grade point average is _____
7. In Marissa’s calculus course, attendance counts for 20% of the grade, quizzes count for 15% of the grade, exams count for 45% of the grade, and the final exam counts for 20% of the grade. Marissa had a 100% average for attendance, 93% for quizzes, 86% for exams, and 81% on the final. Determine Marissa’s course average.
Marissa’s course average is _____ (Type an integer or a decimal. Do not round.)
8. Fill in the blank. The _______ represents the number of standard deviations an observation is from the mean.
9. Suppose babies born after a gestation period of 32 to 35 weeks have a mean weight of 2600 grams and a standard deviation of 800 grams while babies born after a gestation period of 40 weeks have a mean weight of 3000 grams and a standard deviation of 420 grams. If a 32-week gestation period baby weighs 2175 grams and a 40-week gestation period baby weighs 2575 grams, find the corresponding z-scores. Which baby weighs less relative to the gestation period?
Find the corresponding z-scores. Which baby weighs relatively less?
Select the correct choice below and fill in the answer boxes to complete your choice. (Round to two decimal places as needed.)
- The baby born in week 32 weighs relatively less since its z-score, ____ is larger than the z-score of ____ for the baby born in week 40.
- The baby born in week 32 weighs relatively less since its z-score, _____ is smaller than the z-score of for the baby born in week 40.
- The baby born in week 40 weighs relatively less since its z-score, is larger than the z-score of ______ for the baby born in week 32.
- The baby born in week 40 weighs relatively less since its z-score, _____ is smaller than the z-score of _____ for the baby born in week 32.
10. One year Perry had the lowest ERA (earned-run average, mean number of runs yielded per nine innings pitched) of any male pitcher at his school, with an ERA of 2.71. Also, Beth had the lowest ERA of any female pitcher at the school with an ERA of 2.62. For the males, the mean ERA was 4.953 and the standard deviation was 0.733. For the females, the mean ERA was 4.058 and the standard deviation was 0.658. Find their respective z-scores. Which player had the better year relative to their peers, Perry or Beth? (Note: In general, the lower the ERA, the better the pitcher.)
Perry had an ERA with a z-score of ______
Beth had an ERA with a z-score of ______ (Round to two decimal places as needed.)
Which player had a better year in comparison with their peers?
- Beth had a better year because of a lower z-score.
- Perry had a better year because of a lower z-score.
- Perry had a better year because of a higher z-score.
- Beth had a better year because of a higher z-score.
or chat with our tutors