
Navigation » List of Schools, Subjects, and Courses » Math 1140 – Introduction to Statistics » Homeworks » Chapter 5.1 Homework
No Answers We dont have answer to this question yet. If you need help with your homework send us an email  or chat with our tutors
Chapter 5.1 Homework
Chapter 5.1 Homework
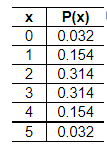
1 The table to the right lists probabilities for the corresponding numbers of girls in three births. What is the random variable, what are its possible values, and are its values numerical? Choose the correct answer below.

- The random variable is x, which is the number of girls in three births. The possible values of x are 0, 1, 2, and 3. The values of the random value x are not numerical.
- The random variable is P(x), which is the probability of a number of girls in three births. The possible values of P(x) are 0.125 and 0.375. The values of the random value P(x) are numerical.
- The random variable is x, which is the number of girls in three births. The possible values of x are 0, 1, 2, and 3. The values of the random value x are numerical.
- The random variable is P(x), which is the probability of a number of girls in three births. The possible values of P(x) are 0.125 and 0.375. The values of the random value P(x) are not numerical.
2. Is the random variable given in the accompanying table discrete or continuous? Explain.
The random variable given in the accompanying table is _____ because _____
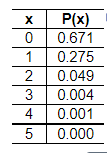
3. Five males with an X-linked genetic disorder have one child each. The random variable x is the number of children among the five who inherit the X-linked genetic disorder. Determine whether a probability distribution is given. If a probability distribution is given, find its mean and standard deviation. If a probability distribution is not given, identify the requirements that are not satisfied. .
Does the table show a probability distribution? Select all that apply
- Yes, the table shows a probability distribution.
- No, not every probability is between 0 and 1 inclusive.
- No, the random variable x’s number values are not associated with probabilities.
- No, the random variable x is categorical instead of numerical.
- No, the sum of all the probabilities is not equal to 1.
Find the mean of the random variable x. Select the correct choice below and, if necessary, fill in the answer box to complete your choice.
Find the standard deviation of the random variable x. Select the correct choice below and, if necessary, fill in the answer box to complete your choice.
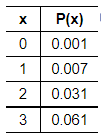
4. When conducting research on color blindness in males, a researcher forms random groups with five males in each group. The random variable x is the number of males in the group who have a form of color blindness. Determine whether a probability distribution is given. If a probability distribution is given, find its mean and standard deviation. If a probability distribution is not given, identify the requirements that are not satisfied
Does the table show a probability distribution? Select all that apply.
- Yes, the table shows a probability distribution.
- No, the random variable x is categorical instead of numerical.
- No, the sum of all the probabilities is not equal to 1.
- No, the random variable x’s number values are not associated with probabilities.
- No, not every probability is between 0 and 1 inclusive.
Find the mean of the random variable x. Select the correct choice below and, if necessary, fill in the answer box to complete your choice.
Find the standard deviation of the random variable x. Select the correct choice below and, if necessary, fill in the answer box to complete your choice.
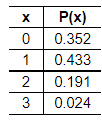
5. Ted is not particularly creative. He uses the pickup line “If I could rearrange the alphabet, I’d put U and I together.” The random variable x is the number of women Ted approaches before encountering one who reacts positively. Determine whether a probability distribution is given. If a probability distribution is given, find its mean and standard deviation. If a probability distribution is not given, identify the requirements that are not satisfied.
Does the table show a probability distribution? Select all that apply.
- Yes, the table shows a probability distribution.
- No, the sum of all the probabilities is not equal to 1.
- No, the random variable x is categorical instead of numerical.
- No, the random variable x’s number values are not associated with probabilities.
- No, not every probability is between 0 and 1 inclusive.
Find the mean of the random variable x. Select the correct choice below and, if necessary, fill in the answer box to complete your choice.
Find the standard deviation of the random variable x. Select the correct choice below and, if necessary, fill in the answer box to complete your choice.
6. A sociologist randomly selects single adults for different groups of three, and the random variable x is the number in the group who say that the most fun way to flirt is in person. Determine whether a probability distribution is given. If a probability distribution is given, find its mean and standard deviation. If a probability distribution is not given, identify the requirements that are not satisfied.

Does the table show a probability distribution? Select all that apply.
- Yes, the table shows a probability distribution.
- No, the random variable x’s number values are not associated with probabilities.
- No, the random variable x is categorical instead of numerical.
- No, the sum of all the probabilities is not equal to 1.
- No, not every probability is between 0 and 1 inclusive.
Find the mean of the random variable x. Select the correct choice below and, if necessary, fill in the answer box to complete your choice.
Find the standard deviation of the random variable x. Select the correct choice below and, if necessary, fill in the answer box to complete your choice.
7. Groups of adults are randomly selected and arranged in groups of three. The random variable x is the number in the group who say that they would feel comfortable in a self-driving vehicle. Determine whether a probability distribution is given. If a probability distribution is given, find its mean and standard deviation. If a probability distribution is not given, identify the requirements that are not satisfied.
Does the table show a probability distribution? Select all that apply.
- Yes, the table shows a probability distribution.
- No, the random variable x’s number values are not associated with probabilities.
- No, the sum of all the probabilities is not equal to 1.
- No, the random variable x is categorical instead of numerical.
- No, not every probability is between 0 and 1 inclusive.
Find the mean of the random variable x. Select the correct choice below and, if necessary, fill in the answer box to complete your choice.
Find the standard deviation of the random variable x. Select the correct choice below and, if necessary, fill in the answer box to complete your choice.
8. Refer to the accompanying table, which describes results from groups of 8 births from 8 different sets of parents. The random variable x represents the number of girls among 8 children. Find the mean and standard deviation for the number of girls in 8 births.
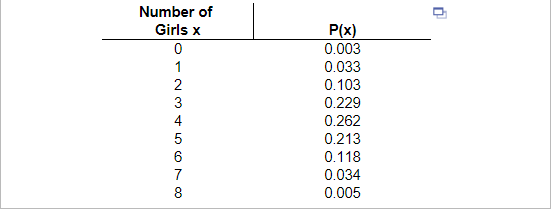
The mean is _____ girl(s). (Round to one decimal place as needed.)
The standard deviation is ____ girl(s). (Round to one decimal place as needed.)
9. The accompanying table describes results from groups of 8 births from 8 different sets of parents. The random variable x represents the number of girls among 8 children. Complete parts (a) through (d) below.

Find the probability of getting exactly 6 girls in 8 births. ____ (Type an integer or a decimal. Do not round.)
Find the probability of getting 6 or more girls in 8 births. ____ (Type an integer or a decimal. Do not round.)
Which probability is relevant for determining whether 6 is a significantly high number of girls in 8 births: the result from part (a) or part (b)?
- The result from part b, since it is the complement of the result of part a.
- The result from part b, since it is the probability of the given or more extreme result.
- The result from part a, since it less than the probability of the given or more extreme result.
- The result from part a, since it is the exact probability being asked.
Is 6 a significantly high number of girls in 8 births? Why or why not? Use 0.05 as the threshold for a significant event.
- Yes, since the appropriate probability is less than 0.05, it is a significantly high number.
- No, since the appropriate probability is less than 0.05, it is not a significantly high number.
- Yes, since the appropriate probability is greater than 0.05, it is a significantly high number.
- No, since the appropriate probability is greater than 0.05, it is not a significantly high number.
10. The accompanying table describes results from groups of 8 births from 8 different sets of parents. The random variable x represents the number of girls among 8 children. Complete parts (a) through (d) below.
Find the probability of getting exactly 1 girl in 8 births. ____ (Type an integer or a decimal. Do not round.)
Find the probability of getting 1 or fewer girls in 8 births. ____ (Type an integer or a decimal. Do not round.)
Which probability is relevant for determining whether 1 is a significantly low number of girls in 8 births: the result from part (a) or part (b)
- Since getting 0 girls is an even lower number of girls than getting 1 girl, the result from part (b) is the relevant probability.
- Since the probability of getting more than 1 girl is the complement of the result from part (b), this is the relevant probability.
- Since the probability of getting 1 girl is the result from part (a), this is the relevant probability.
- Since the probability of getting 0 girls is less likely than getting 1 girl, the result from part (a) is the relevant probability.
Is 1 a significantly low number of girls in 8 births? Why or why not? Use 0.05 as the threshold for a significant event.
- Yes, since the appropriate probability is greater than 0.05, it is a significantly low number.
- No, since the appropriate probability is less than 0.05, it is not a significantly low number.
- No, since the appropriate probability is greater than 0.05, it is not a significantly low number.
- Yes, since the appropriate probability is less than 0.05, it is a significantly low number.
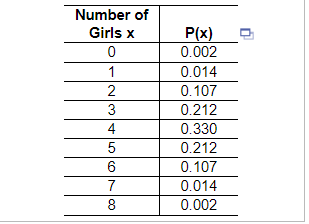
11. Refer to the accompanying table, which describes the number of adults in groups of five who reported sleepwalking. Find the mean and standard deviation for the numbers of sleepwalkers in groups of five.

The mean is ____ sleepwalker(s). (Round to one decimal place as needed.)
The standard deviation is ______sleepwalker(s). (Round to one decimal place as needed.)
12. The accompanying table describes the random variable x, the numbers of adults in groups of five who reported sleepwalking. Complete parts (a) through (d) below.

Find the probability of getting exactly 4 sleepwalkers among 5 adults. ____ (Type an integer or a decimal. Do not round.)
Find the probability of getting 4 or more sleepwalkers among 5 adults. ____ (Type an integer or a decimal. Do not round.)
Which probability is relevant for determining whether 4 is a significantly high number of sleepwalkers among 5 adults: the result from part (a) or part (b)?
- Since the probability of getting 5 sleepwalkers is less likely than getting 4 sleepwalkers, the result from part (a) is the relevant probability.
- Since the probability of getting fewer than 4 sleepwalkers is the complement of the result from part (b), this is the relevant probability.
- Since the probability of getting 4 or more sleepwalkers is the probability of the given or more extreme result, the result from part (b) is the relevant probability.
- Since the probability of getting 4 sleepwalkers is the result from part (a), this is the relevant probability.
Is 4 a significantly high number of 4 sleepwalkers among 5 adults? Why or why not? Use 0.05 as the threshold for a significant event.
- Yes, since the appropriate probability is greater than 0.05, it is a significantly high number.
- Yes, since the appropriate probability is less than 0.05, it is a significantly high number.
- No, since the appropriate probability is less than 0.05, it is not a significantly high number.
- No, since the appropriate probability is greater than 0.05, it is not a significantly high number.
13 In a state’s Pick 3 lottery game, you pay $1.01 to select a sequence of three digits (from 0 to 9), such as 955. If you select the same sequence of three digits that are drawn, you win and collect $303.64. Complete parts (a) through (e).
How many different selections are possible?
What is the probability of winning? ____ (Type an integer or a decimal.)
If you win, what is your net profit? ____ (Type an integer or a decimal.)
Find the expected value. ____ (Round to the nearest hundredth as needed.)
If you bet $1.01 in a certain state’s Pick 4 game, the expected value is −$0.71. Which bet is better, a $1.01 bet in the Pick 3 game or a $1.01 bet in the Pick 4 game? Explain.
- The Pick 4 game is a better bet because it has a larger expected value.
- Neither bet is better because both games have the same expected value.
- The Pick 3 game is a better bet because it has a larger expected value.
14. When playing roulette at a casino, a gambler is trying to decide whether to bet $10 on the number 36 or to bet $10 that the outcome is any one of the three possibilities 00, 0, or 1. The gambler knows that the expected value of the $10 bet for a single number is −$1.06. For the $10 bet that the outcome is 00, 0, or 1, there is a probability of
of making a net profit of $30 and a
probability of losing $10.
- Find the expected value for the $10 bet that the outcome is 00, 0, or 1.
- Which bet is better: a $10 bet on the number 36 or a $10 bet that the outcome is any one of the numbers 00, 0, or 1? Why?
- The expected value is ____ (Round to the nearest cent as needed.)
- Since the expected value of the bet on the number 36 is ____ than the expected value for the bet that the outcome is 00, 0, or 1, the bet on ____ is better.
15. There is a 0.9986 probability that a randomly selected 32-year-old male lives through the year. A life insurance company charges $199 for insuring that the male will live through the year. If the male does not survive the year, the policy pays out $120,000 as a death benefit. Complete parts (a) through (c) below.
From the perspective of the 32-year-old male, what are the monetary values corresponding to the two events of surviving the year and not surviving?
The value corresponding to surviving the year is ______
The value corresponding to not surviving the year is ______ (Type integers or decimals. Do not round.)
If the 32-year-old male purchases the policy, what is his expected value?
The expected value is ____ (Round to the nearest cent as needed.)
Can the insurance company expect to make a profit from many such policies? Why? _______ because the insurance company expects to make an average profit of ____ on every 32-year-old male it insures for 1 year. (Round to the nearest cent as needed.)
16. Fill in the blank. A _______ variable is a variable that has a single numerical value, determined by chance, for each outcome of a procedure.
17. Fill in the blank. A _______ random variable has either a finite or a countable number of values.
18 . Fill in the blank. A _______ random variable has infinitely many values associated with measurements.
19. Fill in the blank. In a probability histogram, there is a correspondence between _______.
20 Fill in the blank. The _______ of a discrete random variable represents the mean value of the outcomes.
or chat with our tutors