
Navigation » List of Schools, Subjects, and Courses » Math 136 – Introduction to Statistics » Homeworks » Section 3.4 Homework
No Answers We dont have answer to this question yet. If you need help with your homework send us an email  or chat with our tutors
Section 3.4 Homework
Section 3.4 Homework
1. Fill in the blank. _______ divide data sets in fourths.
2. Fill in the blank. The _______ represents the number of standard deviations an observation is from the mean.
3. In a certain city, the average 20- to 29-year old man is 72.5 inches tall, with a standard deviation of 3.1 inches, while the average 20- to 29-year old woman is 64.3 inches tall, with a standard deviation of 3.9 inches. Who is relatively taller, a 75-inch man or a 70-inch woman? Find the corresponding z-scores. Who is relatively taller, a 75-inch man or a 70-inch woman? Select the correct choice below and fill in the answer boxes to complete your choice.
(Round to two decimal places as needed.)
- The z-score for the woman, ______ is larger than the z-score for the man, ______so she is relatively taller.
- The z-score for the man, ____________ is larger than the z-score for the woman, ________ so he is relatively taller.
- The z-score for the woman, ________ is smaller than the z-score for the man, _________so she is relatively taller.
- The z-score for the man, _______ is smaller than the z-score for the woman, ________ so he is relatively taller.
4. One year Mike had the lowest ERA (earned-run average, mean number of runs yielded per nine innings pitched) of any male pitcher at his school, with an ERA of 3.14. Also, Julie had the lowest ERA of any female pitcher at the school with an ERA of 3.21. For the males, the mean ERA was 4.778 and the standard deviation was 0.945. For the females, the mean ERA was 3.716 and the standard deviation was 0.638.
Find their respective z-scores. Which player had the better year relative to their peers, Mike or Julie? (Note: In general, the lower the ERA, the better the pitcher.)
Mike had an ERA with a z-score of ________
Julie had an ERA with a z-score of ________ (Round to two decimal places as needed.)
Which player had a better year in comparison with their peers?
- Mike had a better year because of a higher z-score.
- Julie had a better year because of a lower z-score.
- Julie had a better year because of a higher z-score.
- Mike had a better year because of a lower z-score.
5 A highly selective boarding school will only admit students who place at least 2 standard deviations above the mean on a standardized test that has a mean of 200 and a standard deviation of 24.
What is the minimum score that an applicant must make on the test to be accepted?
The minimum score that an applicant must make on the test to be accepted is _______
6. A manufacturer of bolts has a quality-control policy that requires it to destroy any bolts that are more than 4 standard deviations from the mean. The quality-control engineer knows that the bolts coming off the assembly line have mean length of 14 cm with a standard deviation of 0.10 cm. For what lengths will a bolt be destroyed?
Select the correct choice below and fill in the answer box(es) to complete your choice. (Round to one decimal place as needed.)
- A bolt will be destroyed if the length is less than _____ cm.
- A bolt will be destroyed if the length is between ______ cm and ______ cm.
- A bolt will be destroyed if the length is greater than _________ cm.
- A bolt will be destroyed if the length is less than ______ cm or greater than ____ cm.
7. Explain the meaning of the accompanying percentiles.
(a) The 15th percentile of the head circumference of males 3 to 5 months of age in a certain city is 41.0 cm.
(b) The 90th percentile of the waist circumference of females 2 years of age in a certain city is 52.7 cm.
(c) Anthropometry involves the measurement of the human body. One goal of these measurements is to assess how body measurements may be changing over time. The following table represents the standing height of males aged 20 years or older for various age groups in a certain city in 2015. Based on the percentile measurements of the different age groups, what might you conclude?
(a) Explain the meaning of “The 15th percentile of the head circumference of males 3 to 5 months of age in a certain city is 41.0 cm.” Choose the correct answer below.
- 85% of 3- to 5-month-old males have a head circumference that is 41.0 cm or less.
- 15% of 3- to 5-month-old males have a head circumference that is 41.0 cm or less.
- 15% of males have a head circumference that is 41.0 cm or less.
- 15% of 3- to 5-month-old males have a head circumference that is 41.0 cm or more.
(b) Explain the meaning of “The 90th percentile of the waist circumference of females 2 years of age in a certain city is 52.7 cm.” Choose the correct answer below.
- 90% of 2-year-old females have a waist circumference that is 52.7 cm or more.
- 90% of females have a waist circumference that is 52.7 cm or less.
- 10% of 2-year-old females have a waist circumference that is 52.7 cm or less.
- 90% of 2-year-old females have a waist circumference that is 52.7 cm or less.
(c) Anthropometry involves the measurement of the human body. One goal of these measurements is to assess how body measurements may be changing over time. The included table represents the standing height of males aged 20 years or older for various age groups in a certain city in 2015. Based on the percentile measurements of the different age groups, what might you conclude?
At each percentile, the heights generally ______ as the age increases. Assuming that an adult male does not grow after age 20, the percentiles imply that adults born in 1990 are generally _____ than adults who were born in 1950.
8. The following data represent the monthly phone use, in minutes, of a customer enrolled in a fraud prevention program for the past 20 months. The phone company decides to use the upper fence as the cutoff point for the number of minutes at which the customer should be contacted. What is the cutoff point?
The cutoff point is _____ minutes.
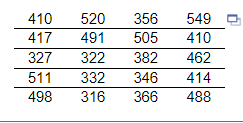
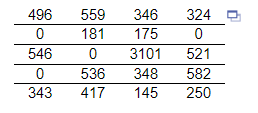
9. The table shows the weekly income of 20 randomly selected full-time students. If the student did not work, a zero was entered
(a) Check the data set for outliers.
(b) Draw a histogram of the data.
(c) Provide an explanation for any outliers
(a) List all the outliers in the given data set. Select the correct choice below and fill in any answer boxes in your choice.
- The outlier(s) is/are _____ (Use a comma to separate answers as needed.)
- There are no outliers.
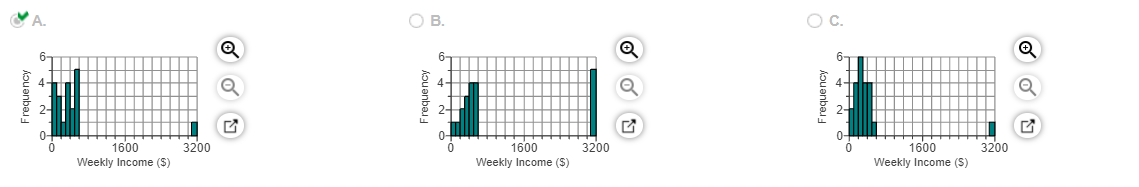
(b) Choose the correct histogram below.
(c) Choose the possible reason(s) for any outlier(s) below. Select all that apply.
- Data entry error
- A student providing false information
- A student with unusually high income
- None of the above
- There are no outliers.
10. The accompanying data represent the pulse rates (beats per minute) of nine students. Treat the nine students as a population. Compute the z-scores for all the students. Compute the mean and standard deviation of these z-scores.
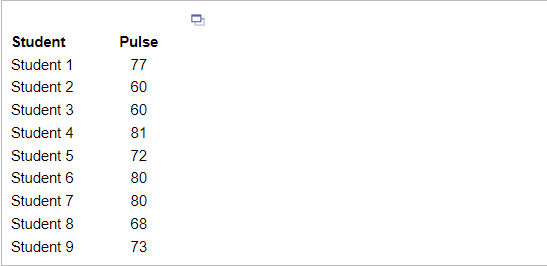
Compute the z-scores for all the students. Complete the table.
Compute the mean of these z-scores.
The mean of the z-scores is _____ (Round to the nearest tenth as needed.)
Compute the standard deviation of these z-scores.
The standard deviation of the z-scores is ____ (Round to the nearest tenth as needed.)
11 A cellular phone company monitors monthly phone usage. The following data represent the monthly phone use in minutes of one particular customer for the past 20 months. Use the given data to answer parts (a) and (b).
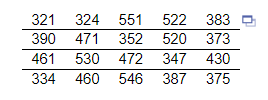
(a) Determine the standard deviation and interquartile range of the data.
(b) Suppose the month in which the customer used 321 minutes was not actually that customer’s phone. That particular month the customer did not use their phone at all, so 0 minutes were used. How does changing the observation from 321 to 0 affect the standard deviation and interquartile range? What property does this illustrate?
The standard deviation _________ and the interquartile range _________
What property does this illustrate? Choose the correct answer below.
- Empirical Rule
- Dispersion
- Weighted Mean
- Resistance
12. Explain the circumstances for which the interquartile range is the preferred measure of dispersion. What is an advantage that the standard deviation has over the interquartile range?
Choose the correct answer below.
- The interquartile range is preferred when the data are skewed or have outliers. An advantage of the standard deviation is that it uses all the observations in its computation.
- The interquartile range is preferred when the data are bell shaped. An advantage of the standard deviation is that it is resistant to extreme values.
- The interquartile range is preferred when the data are bell shaped. An advantage of the standard deviation is that it increases as the dispersion of the data increases
- The interquartile range is preferred when the data are not skewed or no have outliers. An advantage of the standard deviation is that it uses all the observations in its computation.
- The interquartile range is preferred when the distribution is symmetric. An advantage of the standard deviation is that it is resistant to extreme values.
- The interquartile range is preferred when the distribution is symmetric. An advantage of the standard deviation is that it increases as the dispersion of the data increases
or chat with our tutors