
Navigation » List of Schools, Subjects, and Courses » Math 136 – Introduction to Statistics » Exams » Exam 1
No Answers We dont have answer to this question yet. If you need help with your homework send us an email  or chat with our tutors
Exam 1
Exam 1
1. Given the following five-number summary, find the IQR.
2.9, 5.7, 10.0, 13.2, 21.1
- 18.2
- 7.1
- 11.1
- 7.5
2. The accompanying boxplot was constructed in Excel for the amount of soda that was poured by a filling machine into 12-ounce soda cans at a local bottling company. Based on the information given in the boxplot, what shape do you believe the data to have?
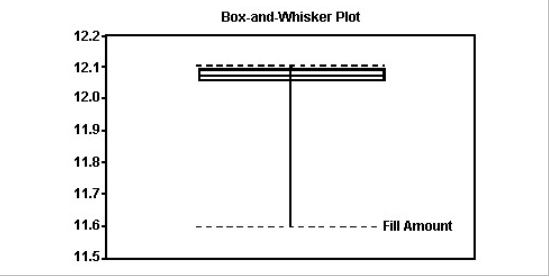
- skewed to the left
- approximately symmetric
- skewed to the right
- cannot be determined
3. Find the z-score for the value 94, when the mean is 98 and the standard deviation is 6.
- z= 0.90
- z= −0.90
- z= −0.83
- z= -0.67
4. Describe the shape of the distribution.
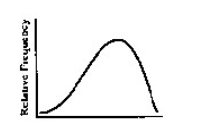
- The distribution is skewed to the left.
- The distribution is bell shaped.
- The distribution is skewed to the right.
- The distribution is uniform.
5 What is the difference between a bar chart and a histogram?
- There is no difference between these two graphical displays.
- The bars in a bar chart may be of various widths while the bars of a histogram are all the same width.
- The bars in a bar chart are all the same width while the bars of a histogram may be of various widths.
- The bars on a bar chart do not touch while the bars of a histogram do touch.
6. Classify the variable as qualitative or quantitative.
the number of seats in a school auditorium
- qualitative
- quantitative
7 The following data represent the time between eruptions and the length of eruption for 8 randomly selected geyser eruptions. Complete parts (a) through (c) below.
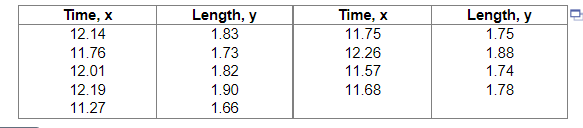
(a) What type of relation appears to exist between time between eruptions and length of eruption?
- Linear, negative association
- Linear, positive association
- A nonlinear pattern.
- No association.
(b) Does the residual plot confirm that the relation between time between eruptions and length of eruption is linear?
- No. The plot of the residuals shows that the spread of the residuals is increasing or decreasing, violating the requirements of a linear model.
- Yes. The plot of the residuals shows a discernible pattern, implying that the explanatory and response variables are linearly related.
- Yes. The plot of the residuals shows no discernible pattern, so a linear model is appropriate.
- No. The plot of the residuals shows no discernible pattern, implying that the explanatory and response variables are not linearly related.
(c) The coefficient of determination is found to be 90.2%.
Provide an interpretation of this value.
The least squares regression line explains ____ of the variation in ____
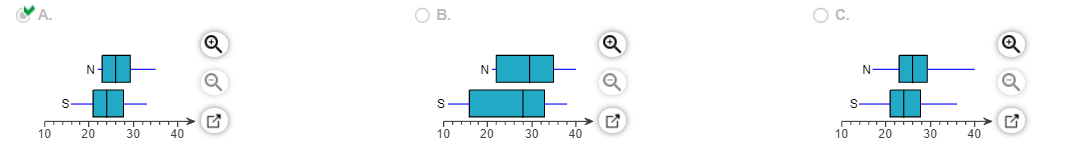
8. The data to the right represent the number of chocolate chips per cookie in a random sample of a name brand and a store brand. Complete parts (a) to (c) below.
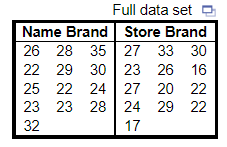
(a) Draw side-by-side boxplots for each brand of cookie. Label the boxplots “N” for the name brand and “S” for the store brand. Choose the correct answer below.
(b) Does there appear to be a difference in the number of chips per cookie?
- Yes. The store brand appears to have more chips per cookie.
- No. There appears to be no difference in the number of chips per cookie.
- Yes. The name brand appears to have more chips per cookie.
- There is insufficient information to draw a conclusion.
(c) Does one brand have a more consistent number of chips per cookie?
- Yes. The store brand has a more consistent number of chips per cookie.
- Yes. The name brand has a more consistent number of chips per cookie.
- No. Both brands have roughly the same number of chips per cookie.
- There is insufficient information to draw a conclusion.
or chat with our tutors