
Navigation » List of Schools, Subjects, and Courses » Math 136 – Introduction to Statistics » Homeworks » Section 4.3 Homework
No Answers We dont have answer to this question yet. If you need help with your homework send us an email  or chat with our tutors
Section 4.3 Homework
Section 4.3 Homework
1. Fill in the blank.
The _______,
, measures the proportion of total variation in the response variable that is explained by the least squares regression line.
2. Fill in the blanks.
Total deviation=_______ deviation+_______ deviation
Choose the correct answer below.
- Total deviation=response deviation + explanatory deviation
- Total deviation=predicted deviation + observed deviation
- Total deviation=positively associated deviation + negatively associated deviation
- Total deviation=unexplained deviation + explained deviation
3. Fill in the blank. A _______ is a scatter diagram with the residuals on the vertical axis and the explanatory variable on the horizontal axis.
4. Analyze the residual plot below and identify which, if any, of the conditions for an adequate linear model is not met. Which of the conditions below might indicate that a linear model would not be appropriate?
- Patterned residuals
- Outlier
- None
- Constant error variance
5. A scatter diagram is given with one of the points drawn in blue (large point). The line drawn in red (dashed line) is the least-squares regression line with the point in blue (the large point) excluded. The line drawn in blue (solid line) is the least-squares regression line with the point in blue (large point) included. On the basis of these graphs, do you think the point in blue is influential?
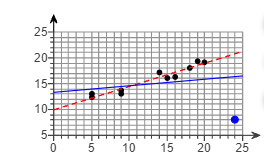
Is the point in blue (large point) influential?
- No, because the point significantly affects the least-squares regression line.
- No, because the point does not significantly affect the least-squares regression line.
- Yes, because the point does not significantly affect the least-squares regression line.
- Yes, because the point significantly affects the least-squares regression line.
6. The following data represent the time between eruptions and the length of eruption for 8 randomly selected geyser eruptions. Complete parts (a) through (c) below.
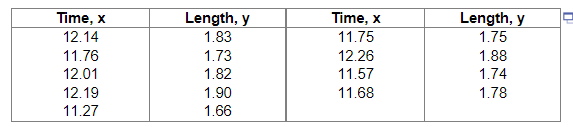
(a) What type of relation appears to exist between time between eruptions and length of eruption?
- Linear, negative association
- Linear, positive association
- A nonlinear pattern.
- No association.
(b) Does the residual plot confirm that the relation between time between eruptions and length of eruption is linear?
- No. The plot of the residuals shows that the spread of the residuals is increasing or decreasing, violating the requirements of a linear model.
- Yes. The plot of the residuals shows a discernible pattern, implying that the explanatory and response variables are linearly related.
- Yes. The plot of the residuals shows no discernible pattern, so a linear model is appropriate.
- No. The plot of the residuals shows no discernible pattern, implying that the explanatory and response variables are not linearly related.
(c) The coefficient of determination is found to be 90.2%. Provide an interpretation of this value.
The least squares regression line explains _____ of the variation in ______
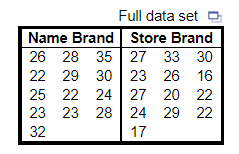
7. The data to the right represent the number of chocolate chips per cookie in a random sample of a name brand and a store brand. Complete parts (a) to (c) below.
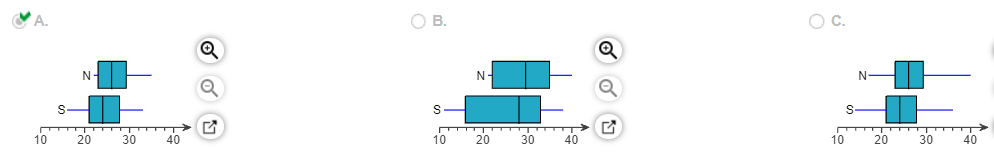
(a) Draw side-by-side boxplots for each brand of cookie. Label the boxplots “N” for the name brand and “S” for the store brand. Choose the correct answer below.
(b) Does there appear to be a difference in the number of chips per cookie?
- Yes. The store brand appears to have more chips per cookie.
- No. There appears to be no difference in the number of chips per cookie.
- Yes. The name brand appears to have more chips per cookie.
- There is insufficient information to draw a conclusion.
(c) Does one brand have a more consistent number of chips per cookie?
- Yes. The store brand has a more consistent number of chips per cookie.
- Yes. The name brand has a more consistent number of chips per cookie.
- No. Both brands have roughly the same number of chips per cookie.
- There is insufficient information to draw a conclusion.
or chat with our tutors