
Navigation » List of Schools, Subjects, and Courses » Math 136 – Introduction to Statistics » Homeworks » Section 4.1 Homework
No Answers We dont have answer to this question yet. If you need help with your homework send us an email  or chat with our tutors
Section 4.1 Homework
Section 4.1 Homework
1. What does it mean to say that two variables are positively associated? Negatively associated? What does it mean to say that two variables are positively associated?
- There is a linear relationship between the variables.
- There is a linear relationship between the variables, and whenever the value of one variable increases, the value of the other variable decreases.
- There is a relationship between the variables that is not linear.
- There is a linear relationship between the variables, and whenever the value of one variable increases, the value of the other variable increases.
What does it mean to say that two variables are negatively associated?
- There is a relationship between the variables that is not linear.
- There is a linear relationship between the variables.
- There is a linear relationship between the variables, and whenever the value of one variable increases, the value of the other variable decreases.
- There is a linear relationship between the variables, and whenever the value of one variable increases, the value of the other variable increases.
2. Fill in the blank below.
If r=_______, then a perfect negative linear relation exists between the two quantitative variables.
3. True or false: Correlation implies causation. Choose the correct response.
- False
- True
4. Determine whether the scatter diagram indicates that a linear relation may exist between the two variables. If the relation is linear, determine whether it indicates a positive or negative association between the variables. Use this information to answer the following.
Do the two variables have a linear relationship?
- The data points have a linear relationship because they lie mainly in a straight line.
- The data points do not have a linear relationship because they do not lie mainly in a straight line.
- The data points do not have a linear relationship because they lie mainly in a straight line.
- The data points have a linear relationship because they do not lie mainly in a straight line.
Do the two variables have a positive or a negative association?
- The two variables have a positive association.
- The two variables have a negative association.
- None of the above
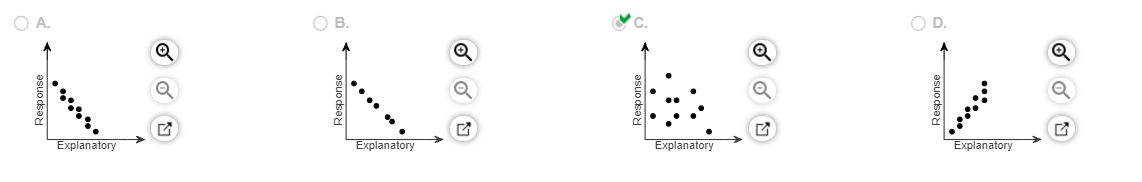
5. Match the linear correlation coefficient to the scatter diagram. r=
Choose the correct graph below.
6. For the accompanying data set, (a) draw a scatter diagram of the data, (b) by hand, compute the correlation coefficient, and (c) determine whether there is a linear relation between x and y.
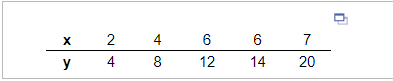
(a) Draw a scatter diagram of the data. Choose the correct graph below.
(b) By hand, compute the correlation coefficient.
The correlation coefficient is _____ (Round to three decimal places as needed.)
(c) Determine whether there is a linear relation between x and y.
Because the correlation coefficient is _______ and the absolute value of the correlation coefficient, _____
is _________ than the critical value for this data set, _______ _____________ linear relation exists between x and y.
7. Will the following variables have positive correlation, negative correlation, or no correlation? Number of doctors on staff at a hospital and number of administrators on staff
Will these variables have positive correlation, negative correlation, or no correlation?
- No correlation
- Positive
- Negative
8. On an international exam, students are asked to respond to a variety of background questions. For the 41 nations that participated in the exam, the correlation between the percentage of items answered in the background questionnaire (used as a proxy for student task persistence) and mean score on the exam was 0.834. Does this suggest there is a linear relation between student task persistence and achievement score? Write a sentence that explains what this result might mean.
Does this suggest there is a linear relation between student task persistence and achievement score? Choose the best response below.
- No, since 0.834 is less than the critical value for 30.
- No, since 0.834 is greater than the critical value for 30.
- Yes, since 0.834 is greater than the critical value for 30.
- Yes, since 0.834 is less than the critical value for 30.
What does this result mean?
- Countries in which students answered a greater percentage of items in the background questionnaire tended to have higher mean scores on the exam.
- There is no linear relation between countries in which students answered a greater percentage of items in the background questionnaire and higher mean scores on the exam.
- Countries in which students answered a lesser percentage of items in the background questionnaire tended to have higher mean scores on the exam.
- Countries in which students cheated on the exam also cheated on the items in the background questionnaire.
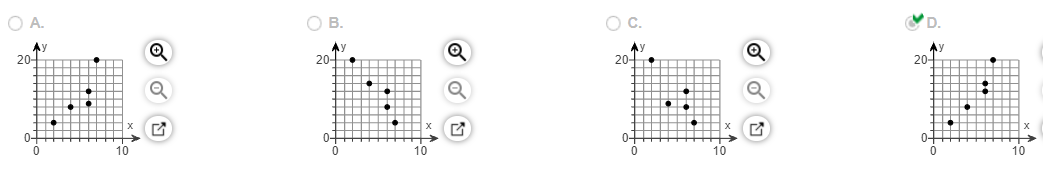
9. The data in the accompanying table represent the annual rates of return for various stocks. If you only wish to invest in two stocks, which two would you select if your goal is to have low correlation between the two investments? Which two would you select if your goal is to have one stock go up when the other goes down?
If your goal is to have low correlation between the two investments, which two should stocks should you select?
- Stock B and Stock C
- Stock A and Stock C
- Stock A and Stock B
If your goal is to have one stock go up when the other goes down, you should select _________ since the linear correlation coefficient for these two stocks _______
10. The linear correlation between violent crime rate and percentage of the population that has a cell phone is
−0.918 for years since 1995. Do you believe that increasing the percentage of the population that has a cell phone will decrease the violent crime rate? What might be a lurking variable between percentage of the population with a cell phone and violent crime rate?
Will increasing the percentage of the population that has a cell phone decrease the violent crime rate? Choose the best option below.
- Yes
- No
What might be a lurking variable between percentage of the population with a cell phone and violent crime rate?
- the average cell phone’s effectiveness as a weapon
- the economy
- the police
- overall cell phone signal strength
11. What does it mean if r=0? Choose the correct answer below.
- A relationship does exist between the variables.
- A linear relationship does exist between the variables.
- No linear relationship exists between the variables.
- No relationship exists between the variables.
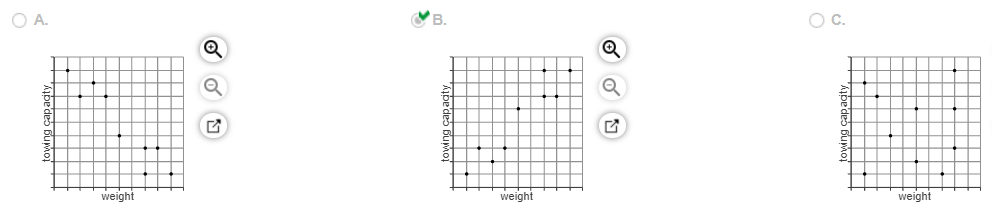
12. Draw a scatter diagram that might represent each relation.
weight of car and its towing capacity
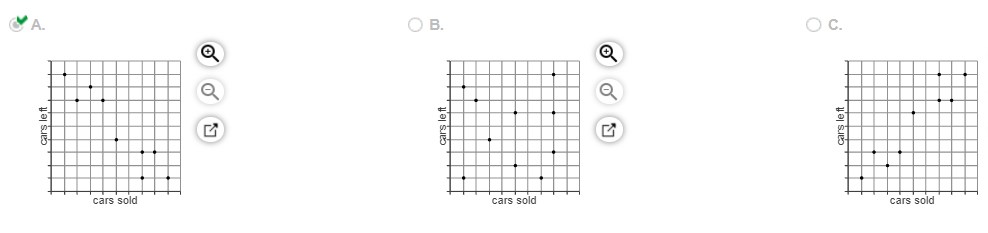
number of cars sold and the remaining cars on the lot
Choose the most accurate scatter diagram below for the first relation.
Choose the most accurate scatter diagram below for the second relation.
or chat with our tutors