
Navigation » List of Schools, Subjects, and Courses » Math 120 – Introductory Probability and Statistics » Exams » Exam 1
No Answers We dont have answer to this question yet. If you need help with your homework send us an email  or chat with our tutors
Exam 1
Exam 1
1. Determine whether the variable is qualitative or quantitative. Breed of dog
Is the variable qualitative or quantitative?
- The variable is quantitative because it is an attribute characteristic.
- The variable is qualitative because it is an attribute characteristic.
- The variable is quantitative because it is a numerical measure.
- The variable is qualitative because it is a numerical measure.
2. Determine whether the quantitative variable is discrete or continuous. Passes made by a defenseman in a hockey game
Is the variable discrete or continuous?
- The variable is discrete because it is not countable.
- The variable is continuous because it is not countable.
- The variable is continuous because it is countable.
- The variable is discrete because it is countable.
3. A polling organization contacts 1808 adult men who are 40 to 60 years of age and live in the United States and asks whether or not they had seen their family doctor within the past 6 months.
What is the population in the study?
- Adult men who are 40 to 60 years of age and live in the United States and have seen their family doctor.
- Adult men who are 40 to 60 years of age and have seen their family doctor.
- Adult men who are 40 to 60 years of age and live in the United States.
- Adult men who are 40 to 60 years of age.
What is the sample in the study?
- The 1808 adult men who are 40 to 60 years of age and have seen their family doctor.
- Adult men who are 40 to 60 years of age.
- The 1808 adult men who are 40 to 60 years of age and live in the United States.
- Adult men who are 40 to 60 years of age and live in the United
4. What is a frame? Choose the correct answer below.
- A frame is the population being studied.
- A frame is the sample taken from the population being studied.
- A frame is a list of the individuals in the sample being studied.
- A frame is a list of the individuals in the population being studied.
5 Define simple random sampling. Choose the correct answer below.
- A sample of size n from a population of size N is obtained through simple random sampling if every possible sample of size n has an equally likely chance of occurring. The sample is then called a simple random sample.
- Simple random sampling is the process of obtaining a sample of size n from a population of the same size n. The sample is then called a simple random sample.
- Simple random sampling is the process of using chance to select individuals from a population to be included in the sample. The sample is then called a simple random sample.
- Simple random sampling is the process of selecting individuals from a population using a convenient sample. The sample is then called a simple random sample.
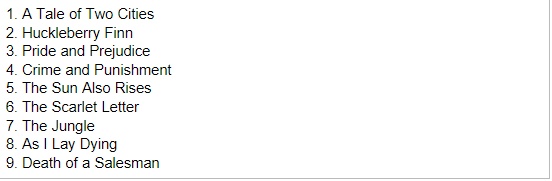
6. As part of a college literature course, students must read three classic works of literature from the provided list. Write a short description of the processes that can be used to generate a simple random sample of three books. Obtain a simple random sample of size 3 from this list.
Which of the following would produce a simple random sample? Select all that apply.
- List each book on a separate piece of paper, place them all in a hat, and pick three.
- Ask someone their opinion on which three books are best, and select those three.
- List the names in alphabetical order and take the first three on the list.
- Number the books from 1 to 9 and use a random number generator to produce 3different numbers from 1 to 9 that correspond to the books selected.
The list of digits below is from a random number generator using technology. Use the list of numbers to obtain a simple random sample of size 3 from this list. If you start on the left and take the first three numbers between 1 and 9, what three books would be selected from the numbered list?
1, 8, 8, 0, 1, 3, 8, 8, 4, 5, 4, 2, 9, 7, 5
- As I Lay Dying, Pride and Prejudice, Crime and Punishment
- Pride and Prejudice, Crime and Punishment, Death of a Salesman
- A Tale of Two Cities, As I Lay Dying, As I Lay Dying
- A Tale of Two Cities, As I Lay Dying, Death of a Salesman
- A Tale of Two Cities, As I Lay Dying, Pride and Prejudice
7. To estimate the percentage of defects in a recent manufacturing batch, a quality control manager at Apple selects every 14th ipod that comes off the assembly line starting with the fourth until she obtains a sample of 70 ipods. What type of sampling is used?
- Cluster
- Systematic
- Simple random
- Convenience
- Stratified
8. To determine customer opinion of their pricing, Home Depot randomly selects 40 check out lines during a certain week and surveys all customers in the check out lines.
What type of sampling is used?
- Stratified
- Cluster
- Simple random
- Convenience
- Systematic
9. To determine her air quality, Charlotte divides up her day into three parts: morning, afternoon, and evening. She then measures her air quality at 4 randomly selected times during each part of the day.
What type of sampling is used?
- Simple random
- Cluster
- Convenience
- Systematic
- Stratified
10. A club wants to sponsor a panel discussion on an upcoming election. The club wants to have four of its members lead the panel discussion. To be fair, however, the panel should consist of two members of each party. Below is a list of members in each party. Obtain a stratified sample of two people from party 1 and two from party 2.
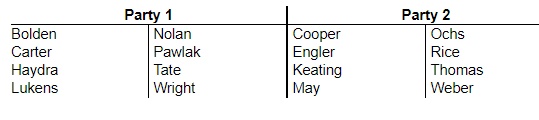
Which of the following is a possible list of club members to lead the panel discussion?
- Tate, Carter, Nolan, Rice
- Tate, Carter, Nolan, Lukens
- Tate, Carter, Rice, Ochs
- Rice, Ochs, Weber, Tate
- Rice, Ochs, Weber,
11. What does it mean when a part of the population is under-represented? Choose the correct answer below.
- A part of the population is under-represented when their answers on a survey tend not to reflect their true feelings.
- A part of the population is under-represented when it is proportionally smaller in its population than in a sample.
- A part of the population is under-represented when it is proportionally smaller in a sample than in its population.
- A part of the population is under-represented when individuals selected to be in the sample who do not respond to the survey have different opinions from those who do.
12. The manager of a shopping mall wishes to expand the number of shops available in the food court. She has a market researcher survey the first 100 customers who come into the food court during weekend afternoons to determine what types of food the shoppers would like to see added to the food court. Complete parts (a) and (b) below.
(a) The survey has bias. Determine whether the flaw is due to the sampling method or the survey itself. For biased surveys, identify the cause of the error. What is the cause of the bias?
- Response bias
- Nonresponse
- Sampling bias
(b) Suggest a remedy to the problem. Which of the following is the best way to remedy this problem?
- Increase the sample size so that more people respond to the question.
- Reword the question so that it is balanced.
- Ask customers throughout the day on both weekdays and weekends.
13. A researcher has decided to test the effectivness of a drug meant to reduce high cholesterol through a completely randomized design. She has obtained 9 volunteers with high cholesterol: Amanda, Brian, Christine, David, Emily, Fred, George, Heather, and Ivan. Number the volunteers 1 through 9, alphabetically. Use the third row of digits in the random number table below to randomly assign 3 of the volunteers to the experimental group (ignore zeros). The remaining volunteers will go into the control group. List the individuals in each group
What are the numbers of the three volunteers selected? ___________________
List the three indivduals assigned to the experimental group. Choose the correct answer below.
- Emily, David, George
- Brian, Ivan, George
- Brian, David, George
- Brian, David, Ivan
List the remaining indivduals assigned to the control group. Choose the correct answer below.
- Heather, Fred, Amanda
- Heather, Fred, Amanda, Emily, Ivan, Christine
- Brian, David, George
14. What is a bar graph? What is a Pareto chart?
What is a bar graph?
- A bar graph is a horizontal or vertical representation of the frequency or relative frequency of the categories. The height of each rectangle represents the category’s frequency or relative frequency.
- A bar graph is a circular graph that uses bars to divide it into segments corresponding to each category. The segments are proportional to the frequency of its category.
- A bar graph represents the frequencies of values either from left-to-right or right-to-left. The different segments of the bar are used to indicate the different frequencies of each category.
What is a Pareto chart?
- A Pareto chart is a display of two data sets side by side where the height of each rectangle represents the category’s frequency or relative frequency.
- A Pareto chart is a combination of a pie chart and a bar graph.
- A Pareto chart is a bar graph whose bars are drawn in decreasing order of frequency or relative frequency.
15. A national survey asked people, “How often do you eat out for dinner, instead of at home?” The frequencies were as follows. Complete parts (a) through (g).
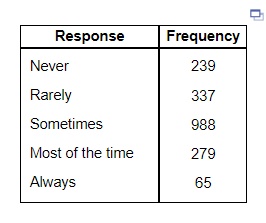
(a) Construct a relative frequency distribution of the data.
| Response | Relative Frequency |
| Neve | |
| Rarely | |
| Sometimes | |
| Most of the time | |
| Always |
(b) What percentage of respondents answered “Always”? __________ (Round to one decimal place as needed.)
(c) What percentage of respondents answered “Never” or “Rarely”? _______ (Round to one decimal place as needed.)
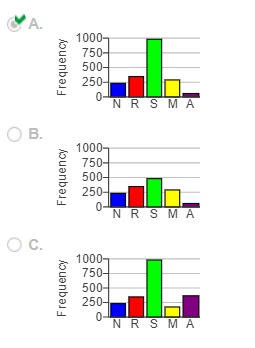
(d) Construct a frequency bar graph. Choose the correct answer below.
(e) Construct a relative frequency bar graph. Choose the correct answer below.
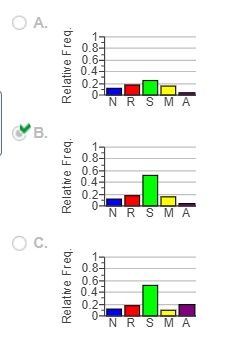
(g) Suppose a person claims that, ”3.4% of all people in the nation always eat out.” Is this a descriptive or inferential statement?
- Descriptive
- Inferential
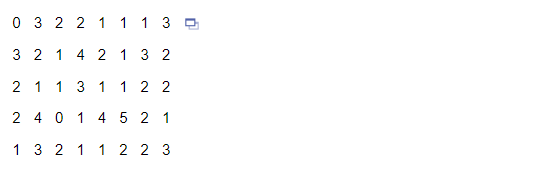
16. A researcher wanted to determine the number of televisions in households. He conducts a survey of 40 randomly selected households and obtains the data in the accompanying table. Complete parts (a) through (h) below.
(a) Are these data discrete or continuous? Explain.
- The given data are continuous because they can take on any real value.
- The given data are discrete because they can only have whole number values.
- The given data are discrete because they can take on any real value.
- The given data are continuous because they can only have whole number values.
(b) Construct a frequency distribution of the data.
| Televisions | Frequency |
| 0 | |
| 1 | |
| 2 | |
| 3 | |
| 4 | |
| 5 |
(c) Construct a relative frequency distribution of the data.
| Televisions | Relative Frequency |
| 0 | |
| 1 | |
| 2 | |
| 3 | |
| 4 | |
| 5 |
(d) What percentage of households in the survey have three televisions? _____ (Type an integer or a decimal. Do not round.)
(e) What percentage of households in the survey have four or more televisions? ______ (Type an integer or a decimal. Do not round.)
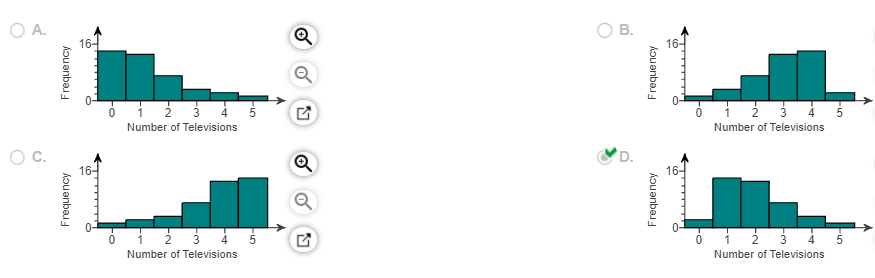
(f) Construct a frequency histogram of the data. Choose the correct graph below.
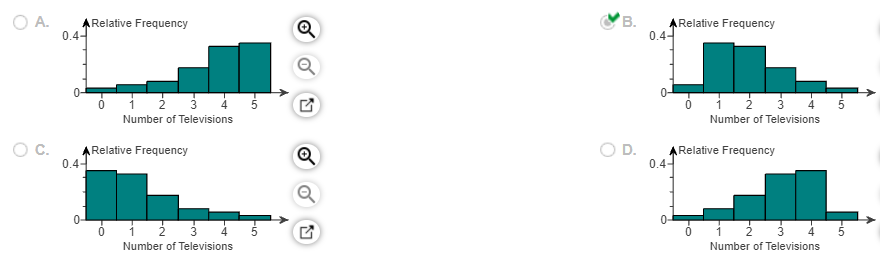
(g) Construct a relative frequency histogram of the data. Choose the correct graph below.
(h) Describe the shape of the distribution. The distribution is _______
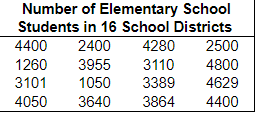
17. A group of 12 randomly selected students were asked how many traffic tickets they have received since they started driving.
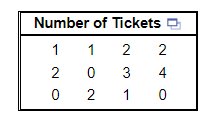
Create a dot plot of the data.
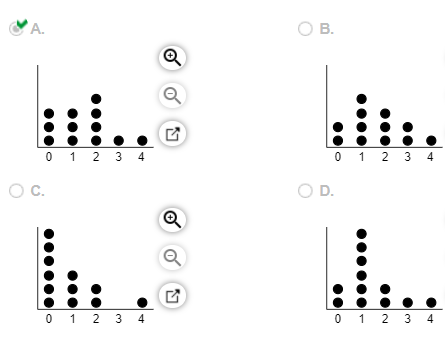
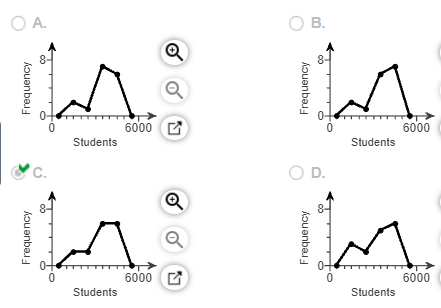
18. The table below gives the number of elementary school children in 16 school districts in a particular region.
(a) Construct a cumulative frequency distribution.
(b) Construct a cumulative relative frequency distribution.
(c) Draw a frequency polygon.
(d) Draw a relative frequency ogive.
(a) Complete the cumulative frequency distribution.
| Students in a District | Cumulative Frequency |
| 1000-1999 | |
| 2000-2999 | |
| 3000-3999 | |
| 4000-4999 | |
(b) Complete the cumulative relative frequency distribution.
| Students in a District | Cumulative Relative Frequency |
| 1000-1999 | |
| 2000-2999 | |
| 3000-3999 | |
| 4000-4999 | |
(c) Which of these is the frequency polygon?
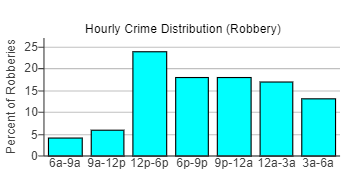
19. A newspaper article claimed that the afternoon hours were the worst in terms of robberies and provided the graph to the right in support of this claim. Explain how this graph is misleading.
Choose the correct answer below.
- The vertical axis has no units. This can mislead readers into thinking that the percentages are actually counts.
- The vertical axis stops at 25%. It should go all the way up to 100% to accurately show percentage data.
- Not all of the time intervals are the same size. Redistributing the time interval so they are all the same size may lead to a different shape.
- All of the bars are the same color, so they tend to blend visually with each other. This makes the graph hard to read.
20. A concrete mix is designed to withstand 3000 pounds per square inch (psi) of pressure. The following data represent the strength of nine randomly selected casts (in psi). 3960, 4090, 3300, 3000, 2950, 3820, 4090, 4050, 3320
Compute the mode strength of the concrete (in psi).
Compute the mode strength of the concrete. Select the correct choice below and, if necessary, fill in the answer box to complete your choice.
- The mode of the strengths of the concrete is _____ psi of pressure. (Round to the nearest tenth as needed.)
- The mode does not exist.
21. An insurance company crashed four cars of the same model at 5 miles per hour. The costs of repair for each of the four crashes were $429, $423, $477, and $230 Compute the mean, median, and mode cost of repair.
Compute the mean cost of repair. Select the correct choice below and, if necessary, fill in the answer box to complete your choice.
- The mean cost of repair is _______ (Round to the nearest cent as needed.)
- The mean does not exist.
Compute the median cost of repair. Select the correct choice below and, if necessary, fill in the answer box to complete your choice.
- The median cost of repair is ______ (Round to the nearest cent as needed.)
- The median does not exist.
Compute the mode cost of repair. Select the correct choice below and, if necessary, fill in the answer box to complete your choice.
- The mode cost of repair is _____ (Round to the nearest cent as needed.)
- The mode does not exist.
or chat with our tutors