
Navigation » List of Schools, Subjects, and Courses » Math 1140 – Introduction to Statistics » Homeworks » Chapter 6.2 Homework
No Answers We dont have answer to this question yet. If you need help with your homework send us an email  or chat with our tutors
Chapter 6.2 Homework
Chapter 6.2 Homework
1. Pulse rates of women are normally distributed with a mean of 77.5 beats per minute and a standard deviation of 11.6 beats per minute. Answer the following questions.
What are the values of the mean and standard deviation after converting all pulse rates of women to z scores using 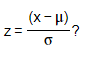
Mean =
Standard deviation =
The original pulse rates are measure with units of “beats per minute”. What are the units of the corresponding z scores? Choose the correct choice below.
- The z scores are measured with units of “beats.”
- The z scores are measured with units of “minutes per beat.”
- The z scores are measured with units of “beats per minute.”
- The z scores are numbers without units of measurement.
2. What is the difference between a standard normal distribution and a nonstandard normal distribution? Choose the correct answer below.
- The standard normal distribution has a mean of 0 and a standard deviation of 1, while a nonstandard normal distribution has a different value for one or both of those parameters.
- The standard normal distribution has a mean of 1 and a standard deviation of 0, while a nonstandard normal distribution has a different value for one or both of those parameters.
- The standard normal distribution has a standard deviation that is less than or equal to the mean, while a nonstandard normal distribution has a standard deviation that is greater than the mean.
- The standard normal distribution has a standard deviation that is greater than the mean, while a nonstandard normal distribution has a standard deviation that is less than or equal to the mean.
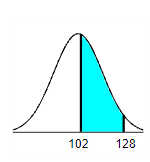
3. Find the area of the shaded region. The graph to the right depicts IQ scores of adults, and those scores are normally distributed with a mean of 100 and a standard deviation of 15.
The area of the shaded region is ________
4. Find the area of the shaded region. The graph to the right depicts IQ scores of adults, and those scores are normally distributed with a mean of 100 and a standard deviation of 15.
The area of the shaded region is _______
5. Find the area of the shaded region. The graph to the right depicts IQ scores of adults, and those scores are normally distributed with a mean of 100 and a standard deviation of 15.
The area of the shaded region is _______
6. Find the area of the shaded region. The graph to the right depicts IQ scores of adults, and those scores are normally distributed with a mean of 100 and a standard deviation of 15.
The area of the shaded region is _______
7. Find the indicated IQ score. The graph to the right depicts IQ scores of adults, and those scores are normally distributed with a mean of 100 and a standard deviation of 15.
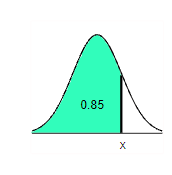
The indicated IQ score, x, is ______
8. Find the indicated IQ score. The graph to the right depicts IQ scores of adults, and those scores are normally distributed with a mean of 100 and a standard deviation of 15.
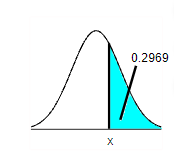
The indicated IQ score is _________
9. Find the indicated IQ score. The graph to the right depicts IQ scores of adults, and those scores are normally distributed with a mean of 100 and a standard deviation of 15.
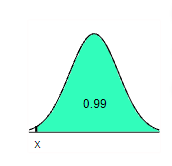
The indicated IQ score, x, is ________
10. Assume that adults have IQ scores that are normally distributed with a mean of 100 and a standard deviation of 20. Find the probability that a randomly selected adult has an IQ less than 120.
The probability that a randomly selected adult has an IQ less than 120 is _______
11. Assume that adults have IQ scores that are normally distributed with a mean of 101.9 and a standard deviation of 24.4. Find the probability that a randomly selected adult has an IQ greater than 143.1. (Hint: Draw a graph.)
The probability that a randomly selected adult from this group has an IQ greater than 143.1 is _______
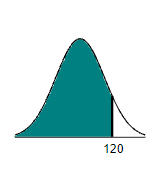
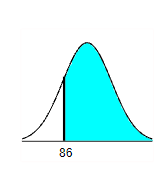
12. Assume that adults have IQ scores that are normally distributed with a mean of ì105 and a standard deviation of 20. Find the probability that a randomly selected adult has an IQ between 86 and 124.
The probability that a randomly selected adult has an IQ between 86 and 124 is _________
13. Engineers want to design seats in commercial aircraft so that they are wide enough to fit 99% of all males. (Accommodating 100% of males would require very wide seats that would be much too expensive.) Men have hip breadths that are normally distributed with a mean of 14.1 and a standard deviation of 1.1 in. Find
. That is, find the hip breadth for men that separates the smallest 99% from the largest 1%.
The hip breadth for men that separates the smallest 99% from the largest 1% is
=
14. Assume that adults have IQ scores that are normally distributed with a mean of 100.9 and a standard deviation 24.6. Find the first quartile Q1, which is the IQ score separating the bottom 25% from the top 75%. (Hint: Draw a graph.)
The first quartile is __________
15. A survey found that women’s heights are normally distributed with mean 63.4 in and standard deviation 2.4 in. A branch of the military requires women’s heights to be between 58 in and 80 in.Find the percentage of women meeting the height requirement. Are many women being denied the opportunity to join this branch of the military because they are too short or too tall?If this branch of the military changes the height requirements so that all women are eligible except the shortest 1% and the tallest 2%, what are the new height requirements?
The percentage of women who meet the height requirement is ______
Are many women being denied the opportunity to join this branch of the military because they are too short or too tall?
- Yes, because the percentage of women who meet the height requirement is fairly large.
- No, because only a small percentage of women are not allowed to join this branch of the military because of their height.
- No, because the percentage of women who meet the height requirement is fairly small.
- Yes, because a large percentage of women are not allowed to join this branch of the military because of their height.
For the new height requirements, this branch of the military requires women’s heights to be at least ______ in and at most ______ in. (Round to one decimal place as needed.)
16. A survey found that women’s heights are normally distributed with mean 62.5 in. and standard deviation 2.4 in. The survey also found that men’s heights are normally distributed with mean 69.8 in. and standard deviation 3.6 in. Most of the live characters employed at an amusement park have height requirements of a minimum of 55 in. and a maximum of 64 in. Complete parts (a) and (b) below.
Find the percentage of men meeting the height requirement. What does the result suggest about the genders of the people who are employed as characters at the amusement park?
The percentage of men who meet the height requirement is _______ (Round to two decimal places as needed.)
Since most men ________ the height requirement, it is likely that most of the characters are _______
If the height requirements are changed to exclude only the tallest 50% of men and the shortest 5% of men, what are the new height requirements?
The new height requirements are a minimum of _______ in. and a maximum of ______ in. (Round to one decimal place as needed.)
17. A survey found that women’s heights are normally distributed with mean 63.9 in. and standard deviation 3.1 in. The survey also found that men’s heights are normally distributed with mean 69.8 in. and standard deviation 3.4 in. Consider an executive jet that seats six with a doorway height of 56.2 in.
Complete parts (a) through (c) below.
What percentage of adult men can fit through the door without bending?
The percentage of men who can fit without bending is _______ (Round to two decimal places as needed.)
Does the door design with a height of 56.2 in. appear to be adequate? Why didn’t the engineers design a larger door?
- The door design is adequate, because the majority of people will be able to fit without bending. Thus, a larger door is not needed.
- The door design is inadequate, because every person needs to be able to get into the aircraft without bending. There is no reason why this should not be implemented.
- The door design is adequate, because although many men will not be able to fit without bending, most women will be able to fit without bending. Thus, a larger door is not needed.
- The door design is inadequate, but because the jet is relatively small and seats only six people, a much higher door would require major changes in the design and cost of the jet, making a larger height not practical.
What doorway height would allow 40% of men to fit without bending?
The doorway height that would allow 40% of men to fit without bending is ______ in. (Round to one decimal place as needed.)
18. A common design requirement is that an environment must fit the range of people who fall between the 5th percentile for women and the 95thpercentile for men. In designing an assembly work table, the sitting knee height must be considered, which is the distance from the bottom of the feet to the top of the knee. Males have sitting knee heights that are normally distributed with a mean of 21.4 in. and a standard deviation of 1.4 in. Females have sitting knee heights that are normally distributed with a mean of 19.1 in. and a standard deviation of 1.3 in. Use this information to answer the following questions.
What is the minimum table clearance required to satisfy the requirement of fitting 95% of men? _____ in. (Round to one decimal place as needed.)
Determine if the following statement is true or false. If there is clearance for 95% of males, there will certainly be clearance for all women in the bottom 5%.
- The statement is true because the 95th percentile for men is greater than the 5th percentile for women.
- The statement is false because some women will have sitting knee heights that are outliers.
- The statement is false because the 95th percentile for men is greater than the 5th percentile for women.
- The statement is true because some women will have sitting knee heights that are outliers.
The author is writing this exercise at a table with a clearance of 23.8 in. above the floor. What percentage of men fit this table? ______ (Round to two decimal places as needed.)
What percentage of women fit this table? _____ (Round to two decimal places as needed.)
Does the table appear to be made to fit almost everyone? Choose the correct answer below.
- The table will fit only 4% of men.
- The table will only fit 1% of women.
- The table will fit almost everyone except about 4% of men with the largest sitting knee heights.
- Not enough information to determine if the table appears to be made to fit almost everyone.
19. Assume that military aircraft use ejection seats designed for men weighing between 135.9 lb and 219 lb. If women’s weights are normally distributed with a mean of 169.8 lb and a standard deviation of 48.5 lb, what percentage of women have weights that are within those limits? Are many women excluded with those specifications?
The percentage of women that have weights between those limits is ______ (Round to two decimal places as needed.)
Are many women excluded with those specifications?
- No, the percentage of women who are excluded, which is the complement of the probability found previously, shows that very few women are excluded.
- Yes, the percentage of women who are excluded, which is the complement of the probability found previously, shows that about half of women are excluded.
- No, the percentage of women who are excluded, which is equal to the probability found previously, shows that very few women are excluded.
- Yes, the percentage of women who are excluded, which is equal to the probability found previously, shows that about half of women are excluded.
20. Assume that human body temperatures are normally distributed with a mean of 98.20°F and a standard deviation of 0.62°F. A hospital uses 100.6°F as the lowest temperature considered to be a fever. What percentage of normal and healthy persons would be considered to have a fever? Does this percentage suggest that a cutoff of 100.6°F is appropriate? Physicians want to select a minimum temperature for requiring further medical tests. What should that temperature be, if we want only 5.0% of healthy people to exceed it? (Such a result is a false positive, meaning that the test result is positive, but the subject is not really sick.)
The percentage of normal and healthy persons considered to have a fever is ______ (Round to two decimal places as needed.)
Does this percentage suggest that a cutoff of 100.6°F is appropriate?
- No, because there is a small probability that a normal and healthy person would be considered to have a fever.
- No, because there is a large probability that a normal and healthy person would be considered to have a fever.
- Yes, because there is a large probability that a normal and healthy person would be considered to have a fever.
- Yes, because there is a small probability that a normal and healthy person would be considered to have a fever.
The minimum temperature for requiring further medical tests should be _______ if we want only 5.0% of healthy people to exceed it. (Round to two decimal places as needed.)
21. The lengths of pregnancies are normally distributed with a mean of 269 days and a standard deviation of 15 days.
A. Find the probability of a pregnancy lasting 309 days or longer.
B. If the length of pregnancy is in the lowest 4%, then the baby is premature. Find the length that separates premature babies from those who are not premature.
The probability that a pregnancy will last 309 days or longer is ____(Round to four decimal places as needed.)
Babies who are born on or before _____ days are considered premature. (Round to the nearest integer as needed.)
22. Use the accompanying data set on the pulse rates (in beats per minute) of males to complete parts (a) and (b) below.
Find the mean and standard deviation, and verify that the pulse rates have a distribution that is roughly normal.
The mean of the pulse rates is ______ beats per minute. (Round to one decimal place as needed.)
The standard deviation of the pulse rates is _____ beats per minute. (Round to one decimal place as needed.)
Explain why the pulse rates have a distribution that is roughly normal. Choose the correct answer below.
- The pulse rates have a distribution that is normal because the mean of the data set is equal to the median of the data set.
- The pulse rates have a distribution that is normal because none of the data points are negative.
- The pulse rates have a distribution that is normal because a histogram of the data set is bell-shaped and symmetric.
- The pulse rates have a distribution that is normal because none of the data points are greater than 2 standard deviations from the mean.
Treating the unrounded values of the mean and standard deviation as parameters, and assuming that male pulse rates are normally distributed, find the pulse rate separating the lowest 2.5% and the pulse rate separating the highest 2.5%. These values could be helpful when physicians try to determine whether pulse rates are significantly low or significantly high.
The pulse rate separating the lowest 2.5% is ______ beats per minute. (Round to one decimal place as needed.)
The pulse rate separating the highest 2.5% is _____ beats per minute. (Round to one decimal place as needed.)
23. Which of the following is not true?
Choose the correct answer below.
- A z-score is a conversion that standardizes any value from a normal distribution to a standard normal distribution.
- The area in any normal distribution bounded by some score x is the same as the area bounded by the equivalent z-score in the standard normal distribution.
- If values are converted to standard z-scores, then procedures for working with all normal distributions are the same as those for the standard normal distribution.
- A z-score is an area under the normal curve.
24. Where would a value separating the top 15% from the other values on the graph of a normal distribution be found?
Choose the correct answer below.
- the left side of the horizontal scale of the graph
- the center of the horizontal scale of the graph
- on the top of the curve
- the right side of the horizontal scale of the graph
25 What conditions would produce a negative z-score? Choose the correct answer below.
- a z-score corresponding to an area located entirely in the right side of the curve
- an area in the top 10% of the graph
- a z-score for a negative area
- a z-score corresponding to an area located entirely in the left side of the curve
26 Complete the following statement. If you are asked to find the 85th percentile, you are being asked to find _____.
Choose the correct answer below.
- a data value associated with an area of 0.85 to its right
- an area corresponding to a z-score of 0.85
- an area corresponding to a z-score of −0.85
- a data value associated with an area of 0.85 to its left
or chat with our tutors