
Navigation » List of Schools, Subjects, and Courses » Math 1140 – Introduction to Statistics » Homeworks » Chapter 6.1 Homework
No Answers We dont have answer to this question yet. If you need help with your homework send us an email  or chat with our tutors
Chapter 6.1 Homework
Chapter 6.1 Homework
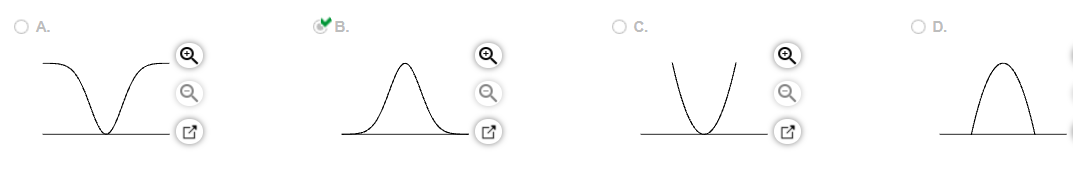
1. A normal distribution is informally described as a probability distribution that is “bell-shaped” when graphed. Draw a rough sketch of a curve having the bell shape that is characteristic of a normal distribution.
Choose the correct answer below.
2. What does the notation
indicate? The expression
denotes the z score with an area of
________
3. Find the area of the shaded region. The graph depicts the standard normal distribution with mean 0 and standard deviation 1.
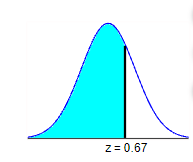
The area of the shaded region is ______ (Round to four decimal places as needed.)
4. Find the area of the shaded region. The graph depicts the standard normal distribution of bone density scores with mean 0 and standard deviation 1.
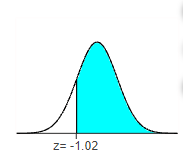
The area of the shaded region is ______ (Round to four decimal places as needed.)
5. Find the area of the shaded region. The graph depicts the standard normal distribution of bone density scores with mean 0 and standard deviation 1.
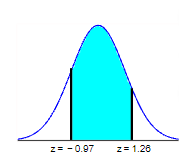
The area of the shaded region is __________
6. Find the indicated z score. The graph depicts the standard normal distribution with mean 0 and standard deviation 1.
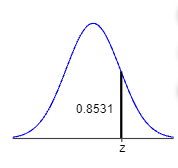
The indicated z score is ________ (Round to two decimal places as needed.)
7. Find the indicated z score. The graph depicts the standard normal distribution with mean 0 and standard deviation 1.
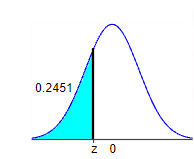
The indicated z score is ____________
8. Find the indicated z score. The graph depicts the standard normal distribution with mean 0 and standard deviation 1.
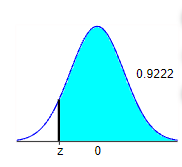
The indicated z score is _______ (Round to two decimal places as needed.)
9. Find the indicated z score. The graph depicts the standard normal distribution with mean 0 and standard deviation 1.
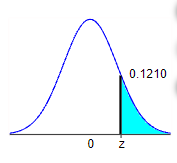
The indicated z score is _____
10.
Assume that a randomly selected subject is given a bone density test. Those test scores are normally distributed with a mean of 0 and a standard deviation of 1. Find the probability that a given score is less than −0.51 and draw a sketch of the region.
Sketch the region. Choose the correct graph below.
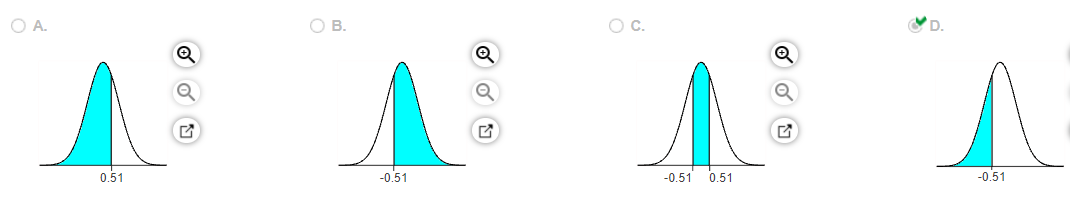
The probability is _______ (Round to four decimal places as needed.)
11. Assume that a randomly selected subject is given a bone density test. Those test scores are normally distributed with a mean of 0 and a standard deviation of 1. Find the probability that a given score is less than 1.85 and draw a sketch of the region.
Sketch the region. Choose the correct graph below.
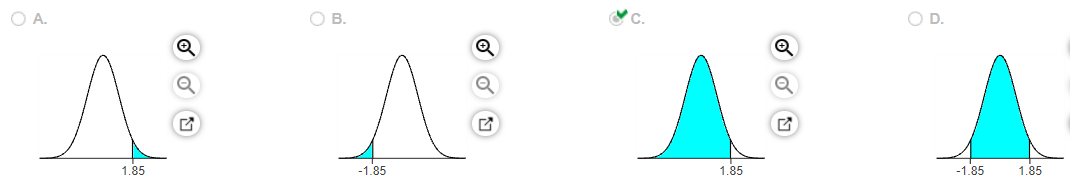
The probability is _____ (Round to four decimal places as needed.)
12. Assume that a randomly selected subject is given a bone density test. Those test scores are normally distributed with a mean of 0 and a standard deviation of 1. Draw a graph and find the probability of a bone density test score greater than 0.45.
Sketch the region. Choose the correct graph below.
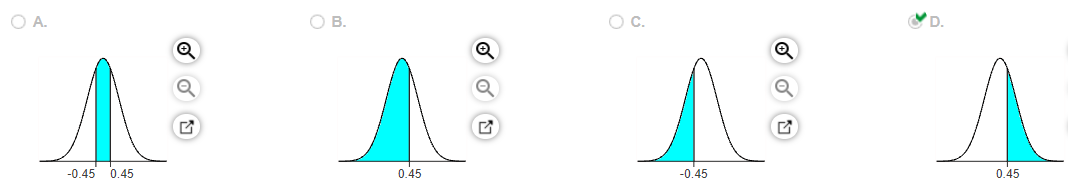
The probability is _____
13. Assume that a randomly selected subject is given a bone density test. Those test scores are normally distributed with a mean of 0 and a standard deviation of 1. Draw a graph and find the probability of a bone density test score greater than −1.93.
Sketch the region. Choose the correct graph below.
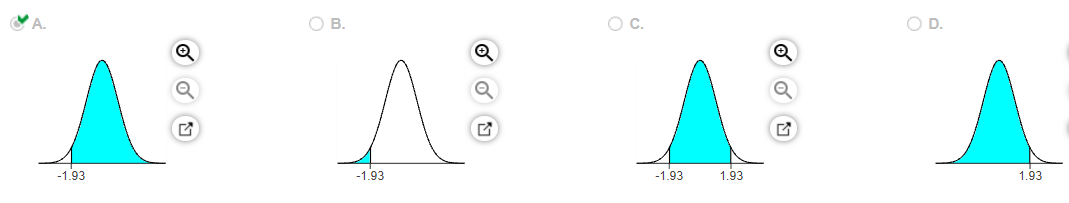
The probability is ______ (Round to four decimal places as needed.)
14. Assume that thermometer readings are normally distributed with a mean of 0°C and a standard deviation of 1.00°C. A thermometer is randomly selected and tested. For the case below, draw a sketch, and find the probability of the reading. (The given values are in Celsius degrees.)
Between 0.50 and 1.75
Draw a sketch. Choose the correct graph below.
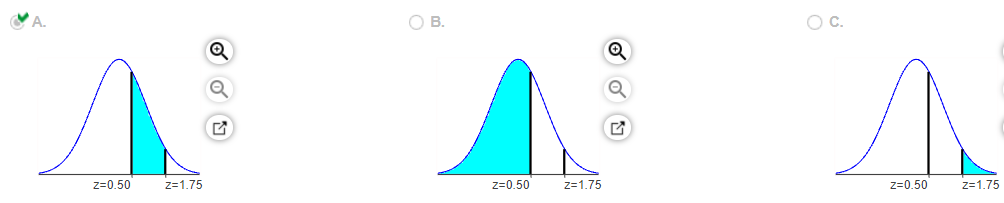
The probability of getting a reading between 0.50°C and 1.75°C is ________ (Round to four decimal places as needed.)
15. Assume the readings on thermometers are normally distributed with a mean of 0°C and a standard deviation of 1.00°C. Find the probability that a randomly selected thermometer reads between −1.55 and −0.94 and draw a sketch of the region.
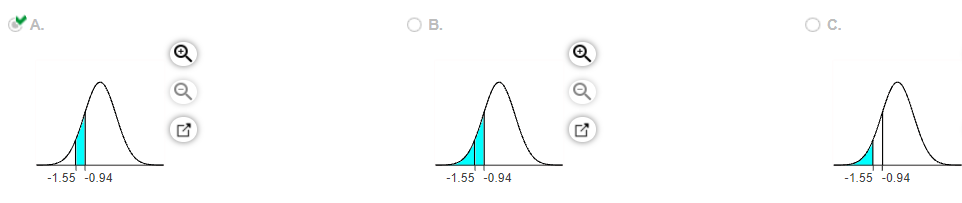
The probability is _______
16. Assume that a randomly selected subject is given a bone density test. Those test scores are normally distributed with a mean of 0 and a standard deviation of 1. Draw a graph and find the probability of a bone density test score between −2.04 and 2.04.
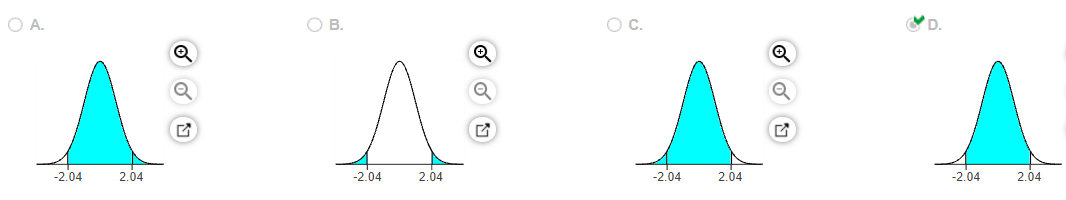
Sketch the region. Choose the correct graph below.
The probability is _______ (Round to four decimal places as needed.)
17. Assume that a randomly selected subject is given a bone density test. Those test scores are normally distributed with a mean of 0 and a standard deviation of 1. Find the probability that a given score is between −2.16 and 3.85 and draw a sketch of the region.
Sketch the region. Choose the correct graph below.
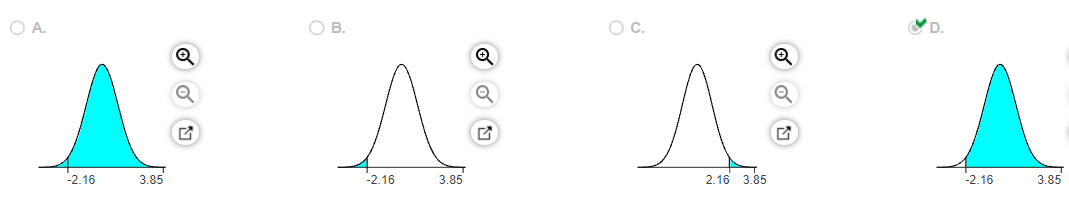
The probability is _______ (Round to four decimal places as needed.)
18. Assume that a randomly selected subject is given a bone density test. Those test scores are normally distributed with a mean of 0 and a standard deviation of 1. Find the probability that a given score is less than 3.74 and draw a sketch of the region.
Sketch the region. Choose the correct graph below.
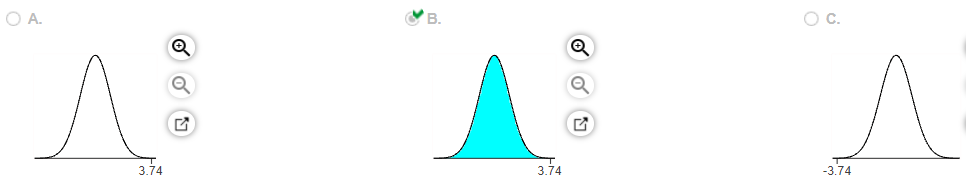
The probability is _______ (Round to four decimal places as needed.)
19. Assume that a randomly selected subject is given a bone density test. Those test scores are normally distributed with a mean of 0 and a standard deviation of 1. Draw a graph and find the probability of a bone density test score greater than 0.
Sketch the region. Choose the correct graph below.
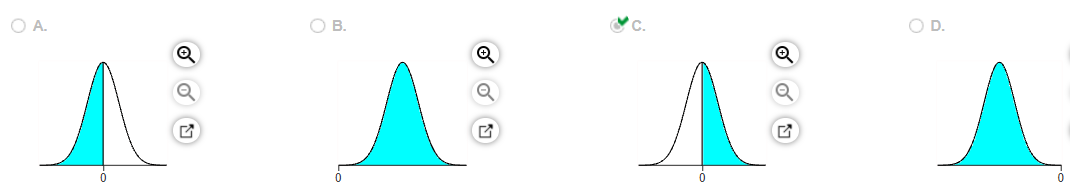
The probability is _______ (Round to four decimal places as needed.)
20. Assume that a randomly selected subject is given a bone density test. Those test scores are normally distributed with a mean of 0 and a standard deviation of 1. Draw a graph and find the probability of a bone density test score less than 0.
Sketch the region. Choose the correct graph below.
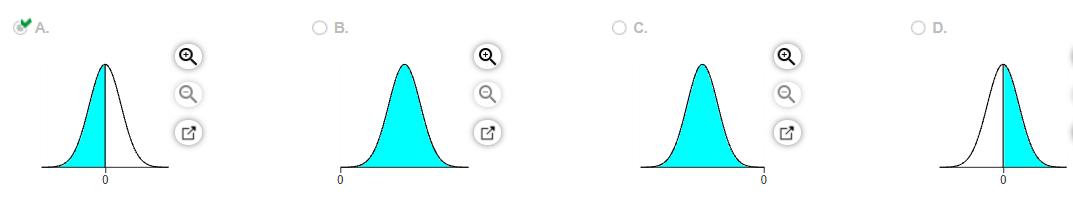
The probability is _____ (Round to four decimal places as needed.)
or chat with our tutors