
Navigation » List of Schools, Subjects, and Courses » Math 138 – Statistics » Quizzes » Quiz 4
No Answers We dont have answer to this question yet. If you need help with your homework send us an email  or chat with our tutors
Quiz 4
Quiz 4
1. The table below shows the number of miles run and the number of phone calls made yesterday by each of 6 people. Create a scatter plot for the data.
| Number of miles | Number of phone calls |
| 5 | 7 |
| 8 | 13 |
| 9 | 2 |
| 10 | 12 |
| 13 | 5 |
| 14 | 8 |
2. Below are four bivariate data sets and their scatter plots. (Note that all of the scatter plots are displayed with the same scale.) Each data set is made up of sample values drawn from a population.
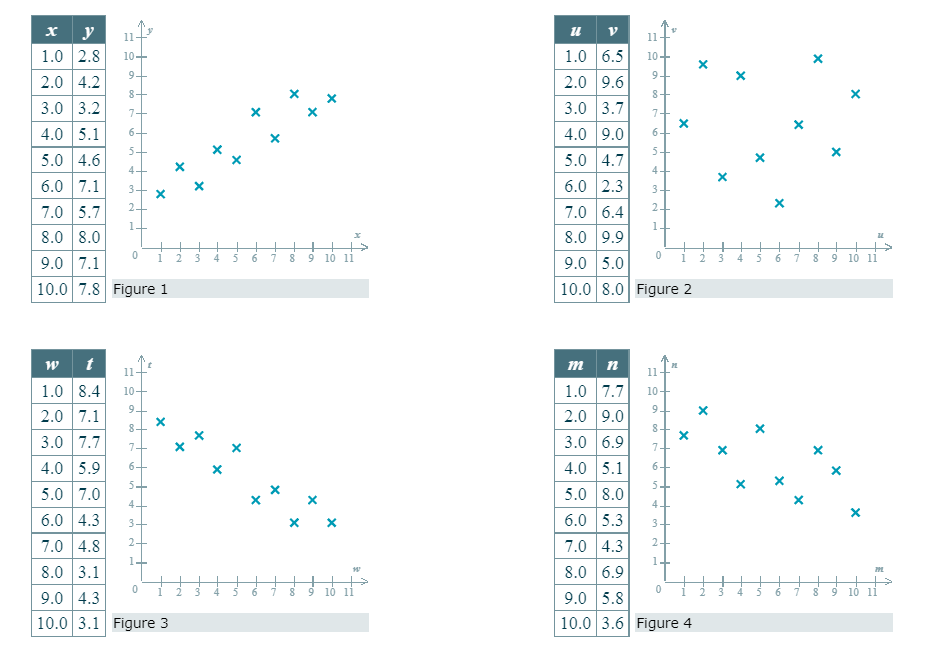
Answer the following questions about the relationships between pairs of variables and the values of r, the sample correlation coefficient. The same response may be the correct answer for more than one question.
(a)For which data set is the sample correlation coefficient r equal to 1?
(b)For which data set is the sample correlation coefficient r closest to −1?
(c)For which data set is the sample correlation coefficient r closest to 0?
(d)Which data set indicates the strongest positive linear relationship between its two variables?
3. The table and scatter plot show the time spent watching TV, x, and the time spent doing homework, y, by each of 11 students last week.The equation of the line of best fit is 
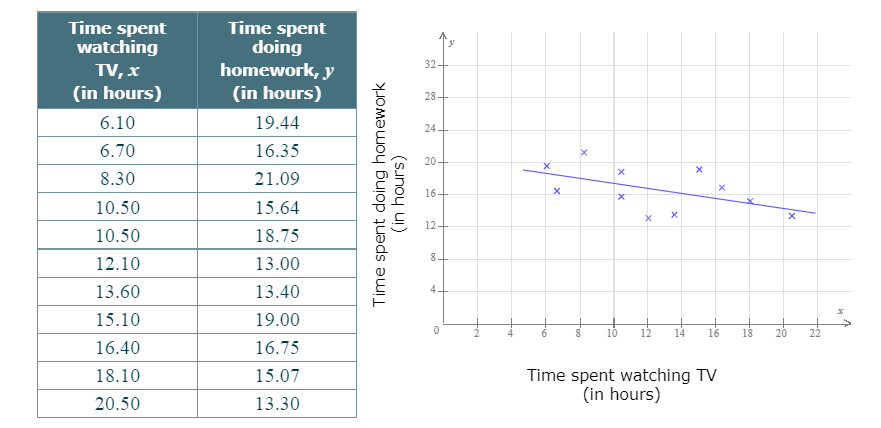
Use the equation of the line of best fit, and use the table above, to fill in the blanks below.
Give exact answers, not rounded approximations.
| Time spent watching TV (in hours) | Observed time spent doing homework (in hours) | Predicted time spent doing homework (in hours) | Residual (in hours) |
| 12.10 | |||
| 15.10 |
or chat with our tutors