
Navigation » List of Schools, Subjects, and Courses » Math 138 – Statistics » Homeworks » 4.1 Homework
No Answers We dont have answer to this question yet. If you need help with your homework send us an email  or chat with our tutors
4.1 Homework
4.1 Homework
1. Compute the correlation coefficient.
The correlation coefficient is r= _______ . Round the answer to three decimal places as needed.
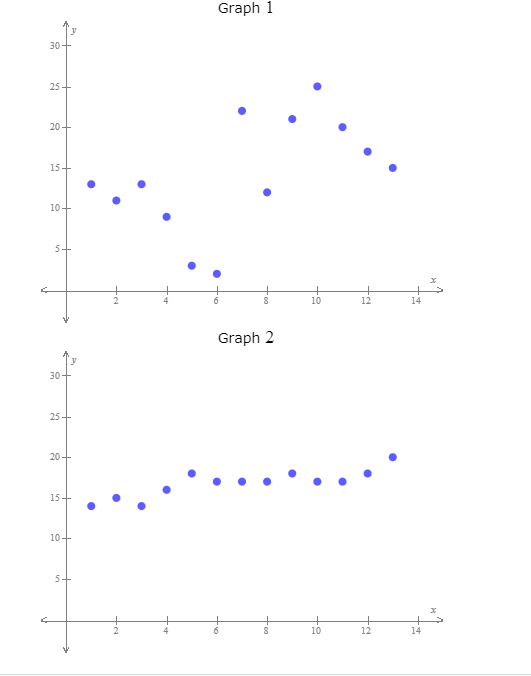
2. Determine whether the correlation coefficient is an appropriate summary for the scatterplot and explain your reasoning.
The correlation coefficient
3. Determine whether the correlation coefficient is an appropriate summary for the scatterplot and explain your reasoning.
The correlation coefficient
4. Determine whether the association between the two variables is positive or negative.
The amount of time spent studying for a statistics exam and the score on the exam
The association between the amount of time spent studying for a statistics exam and the score on the exam is
Determine whether the association between the two variables is positive or negative.
The amount of money a person spends on bills per month and the amount of money the person has available to spend on entertainment
The association between the amount of money a person spends on bills per month and the amount of money the person has available to spend on entertainment is _______________________
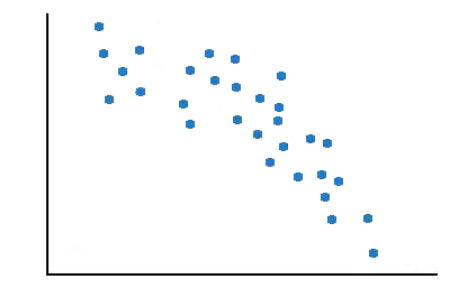
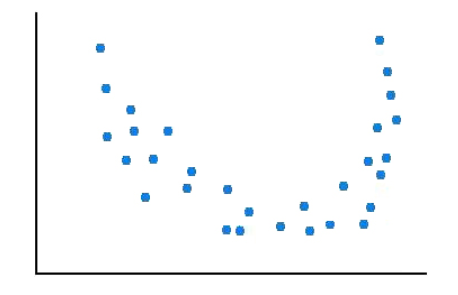
6. One of the two scatter plots below has correlation coefficient 0.81, and the other has correlation coefficient 0.29.
(a) Which graph shows a correlation coefficient of 0.81?
(b) The graph with a correlation coefficient of 0.81 indicates what kind of relationship between the two variables? The graph with a correlation coefficient of 0.81 indicates
- a quadratic relationship between the two variables.
- a linear relationship between the two variables.
- no relationship between the two variables.
- an exponential relationship between the two variables.
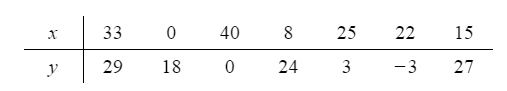
7. Government funding: The following table presents the budget (in millions of dollars) for selected organizations that received U.S. government funding for arts and culture in both 2006 and last year.
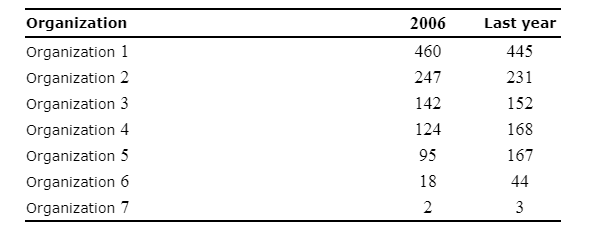
(a) Construct a scatterplot of the funding last year y versus the funding in 2006 x.
(b) Compute the correlation coefficient between the funding in 2006 and the funding last year. Round the answer to at least three decimal places.
(c) For an organization whose funding in 2006 was above the average, would you expect their funding last year to be above or below average? Explain.
For an organization whose funding in 2006 was above the average, I would expect the funding last year to be _________ average since r is _________________
(d) Which of the following is the best interpretation of the correlation coefficient?
- If we increased the funding for an organization in 2006, this caused the funding last year to increase.
- If we increased the funding for an organization last year, this caused the funding in 2006 to increase.
- Some organizations get more funding than others, and those that were more highly funded in 2006 were generally more highly funded last year as well.
8. Ice cream sales and sunglasses: In a survey of sales data from a recent summer, it is discovered that there is a positive correlation between ice cream sales and sales of sunglasses. Do you believe that purchasing ice cream causes a person to want to buy sunglasses? Why or why not?
Purchasing ice cream _________a person to want to buy sunglasses since
or chat with our tutors