
Navigation » List of Schools, Subjects, and Courses » Math 1140 – Introduction to Statistics » Exams » Exam 1
No Answers We dont have answer to this question yet. If you need help with your homework send us an email  or chat with our tutors
Exam 1
Exam 1
1. Suppose the data represent the inches of rainfall in April for a certain city over the course of 20 years. Given the quartiles Q1=1.870, Q2=3.680, and Q3=5.140, determine the lower and upper fences. Are there any outliers, according to this criterion?
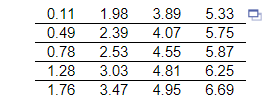
The lower fence is ________ (Round to three decimal places as needed.)
The upper fence is ________ (Round to three decimal places as needed.)
Are there any outliers in the given data set?
- Yes, there are values above the upper fence.
- Yes, there are values above the upper fence and below the lower fence.
- No, all the values are between the lower and upper fences.
- Yes, there are values below the lower fence.
What are the outliers? Select the correct choice below and fill in any answer boxes in your choice.
- The outlier(s) is/are ______ (Use a comma to separate answers as needed.)
- There are no outliers.
2. Identify which of these types of sampling is used: random, systematic, convenience, stratified, or cluster. A large company wants to administer a satisfaction survey to its current customers. Using their customer database, the company randomly selects 30 customers and asks them about their level of satisfaction with the company.
What type of sampling is used?
- Stratified
- Random
- Systematic
- Cluster
- Convenience
3. Find the (a) mean, (b) median, (c) mode, and (d) midrange for the data and then (e) answer the given question. Listed below are the weights in pounds of 11 players randomly selected from the roster of a championship sports team. Are the results likely to be representative of all players in that sport’s league?
263 234 180 216 184 260 275 248 234 274 260
Find the mean.
The mean is ________ pound(s). (Type an integer or a decimal rounded to one decimal place as needed.)
Find the median.
The median is ______ pound(s). (Type an integer or a decimal rounded to one decimal place as needed.)
Find the mode.
Select the correct choice below and, if necessary, fill in the answer box to complete your choice.
- The mode(s) is(are) _______ pound(s). (Type an integer or a decimal. Do not round. Use a comma to separate answers as needed.)
- There is no mode.
Find the midrange.
The midrange is _____ pound(s). (Type an integer or a decimal rounded to one decimal place as needed.)
Are the results likely to be representative of all players in that sport’s league?
- The results are not likely to be representative because the median is not equal to the mean.
- The results are not likely to be representative because the median is not equal to the mode.
- The results are not likely to be representative because the championship team may not be representative of the entire league.
- The results are likely to be representative because a championship team is most likely representative of the entire league.
4. Use z scores to compare the given values. Based on sample data, newborn males have weights with a mean of 3269.5 g and a standard deviation of 690.8 g. Newborn females have weights with a mean of 3087.4 g and a standard deviation of 735.6 g. Who has the weight that is more extreme relative to the group from which they came: a male who weighs 1500 g or a female who weighs 1500 g?
Since the z score for the male is ________ and the z score for the female is _________, the ______ has the weight that is more extreme. (Round to two decimal places.)
5. Construct the cumulative frequency distribution for the given data.
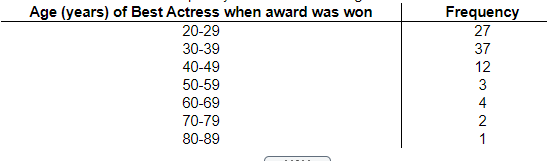
| Age (years) of best actress when the award was won | Cumulative Frequency |
| Less than 30 | |
| Less than 40 | |
| Less than 50 | |
| Less than 60 | |
| Less than 70 | |
| Less than 80 | |
| Less than 90 |
6. Identify which of these types of sampling is used: random, systematic, convenience, stratified, or cluster. A market researcher has partitioned all residents of a certain region into categories of young (age 0-30), middle aged (age 31-60), and senior (over age 60). She is surveying 44 people from each category.
What type of sampling is used?
- systematic sampling
- Stratified
- sampling
- convenience sampling
- random sampling
- cluster sampling
7. Find the variance for the given sample data. Round your answer to one more decimal place than the original data.
7 7 2 5 1
- 11.8
- 7.8
- 7.7
- 6.2
8. A test score of 48.4 on a test having a mean of 66 and a standard deviation of 11. Find the z-score corresponding to the given value and use the z-score to determine whether the value is significant. Consider a score to be significant if its z-score is less than −2.00 or greater than 2.00. Round the z-score to the nearest tenth if necessary.
- 1.6; not significant
- −1.6; significant
- −17.6; significant
- −1.6; not significant
9. Find the standard deviation for the given sample data. Round your answer to one more decimal place than the original data.
18 18 18 9 15 5 10 5 15
- 5.8
- 5.4
- 5.1
- 1.6
10. Determine which of the four levels of measurement (nominal, ordinal, interval, ratio) is most appropriate for the data below.
Social security numbers
Choose the correct answer below.
- The ratio level of measurement is most appropriate because the data can be ordered,differences (obtained by subtraction) can be found and are meaningful, and there is anatural starting point.
- The interval level of measurement is most appropriate because the data can be ordered, differences (obtained by subtraction) can be found and are meaningful, and there is no natural starting point.
- The nominal level of measurement is most appropriate because the data cannot be ordered.
- The ordinal level of measurement is most appropriate because the data can be ordered, but differences (obtained by subtraction) cannot be found or are
11. Determine whether the given value is a statistic or a parameter. Choose the correct answer below.
- The value is a because it is a numerical measurement describing some characteristic of a sample
- The value is a because it is a numerical measurement describing some characteristic of a sample
- The value is a because it is a numerical measurement describing some characteristic of a population
- The value is a because it is a numerical measurement describing some characteristic of a population
12. If your score on your next statistics test is converted to a z-score, which of these z-scores would you prefer?
- -2.00
- 2.00
- -1.00
- 0
13. The accompanying data represent the miles per gallon of a random sample of cars with a three-cylinder, 1.0 liter engine.
(a) Compute the z-score corresponding to the individual who obtained miles per gallon. Interpret this result.
(b) Determine the quartiles.
(c) Compute and interpret the interquartile range, IQR.
(d) Determine the lower and upper fences. Are there any outliers?
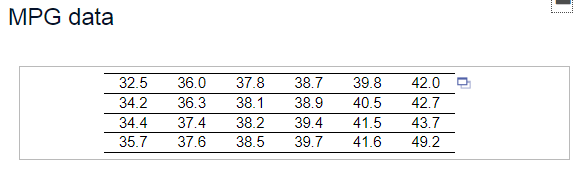
(a) Compute the z-score corresponding to the individual who obtained 38.5 miles per gallon. Interpret this result.
The z-score corresponding to the individual is _____ and indicates that the data value is ______ standard deviation(s) ____ the ____. (Type integers or decimals rounded to two decimal places as needed.)
(b) Determine the quartiles.
Q1 = ____mpg
Q2 = ____ mpg
Q3 = ____ mpg
(Type integers or decimals. Do not round.)
(c) Compute and interpret the interquartile range, IQR. Select the correct choice below and fill in the answer box to complete your choice. (Type an integer or a decimal. Do not round.)
The interquartile range is ____ mpg. It is the range of _____________________.
(d) Determine the lower and upper fences. Are there any outliers?
The lower fence is _____
The upper fence is _____
(Type integers or decimals. Do not round.)
Are there any outliers? Select the correct choice below and, if necessary, fill in the answer box to complete your choice.
- The outlier(s) is/are _____ (Type an integer or a decimal. Do not round. Use a comma to separate answers as needed.)
- There are no outliers.
14. The frequency distribution below summarizes the home sale prices in the city of Summerhill for the month of June. Determine the width of each class. Round to the nearest whole number as needed.
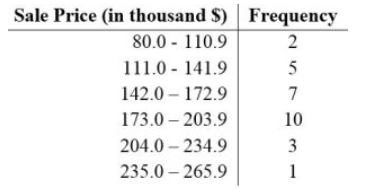
- 30
- 31
- 61
- 28
15. Use the given sample data to find
.
49 52 52 52 74 67 55 55
- 67
- 55
- 61
- 6
16. Identify the symbols used for each of the following: (a) sample standard deviation; (b) population standard deviation; (c) sample variance; (d) population variance.
a. The symbol for sample standard deviation is s.
b. The symbol for population standard deviation is
.
c. The symbol for sample variance is
.
d. The symbol for population variance is
.
17. Use the given categorical data to construct the relative frequency distribution.
Natural births randomly selected from four hospitals in a highly populated region occurred on the days of the week (in the order of Monday through Sunday) with the frequencies 52,63, 72, 57, 57, 44, 55. Does it appear that such births occur on the days of the week with equal frequency?
Construct the relative frequency distribution.
| Day | Relative Frequency |
| Monday | |
| Tuesday | |
| Wednesda | |
| Thursday | |
| Friday | |
| Saturday | |
| Sunday |
Let the frequencies be substantially different if any frequency is at least twice any other frequency. Does it appear that these births occur on the days of the week with equal frequency?
- No, it appears that births occur on the days of the week with frequencies that are substantially different.
- Yes, it appears that births occur on the days of the week with frequencies that are about the same.
- Yes, it appears that births occur on the days of the week with frequencies that are exactly the same.
- It is impossible to determine with the given information.
or chat with our tutors