
Navigation » List of Schools, Subjects, and Courses » Math 227 – Statistics » Quizzes » Chapter 4 Quiz
No Answers We dont have answer to this question yet. If you need help with your homework send us an email  or chat with our tutors
Chapter 4 Quiz
Chapter 4 Quiz
1. A data set is given below.
(a) Draw a scatter diagram. Comment on the type of relation that appears to exist between x and y.
(b) Given that x=3.5000, sx=2.3452, y=4.2167, sy=1.6570, and r=−0.9393, determine the least-squares regression line.
(c) Graph the least-squares regression line on the scatter diagram drawn in part (a).
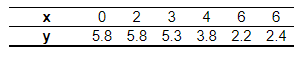
(a) Choose the correct graph below.
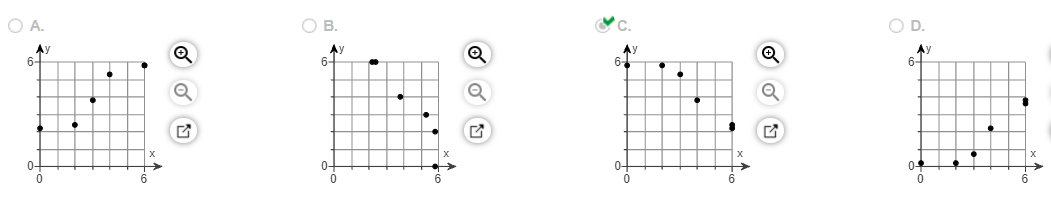
2. Researchers initiated a long-term study of the population of American black bears. One aspect of the study was to develop a model that could be used to predict a bear’s weight (since it is not practical to weigh bears in the field). One variable thought to be related to weight is the length of the bear. The accompanying data represent the lengths and weights of 12 American black bears. Complete parts (a) through (d) below.
(a) Which variable is the explanatory variable based on the goals of the research?
- The weight of the bear
- The number of bears
- The length of the bear
(b) Draw a scatter diagram of the data. Choose the correct graph below.
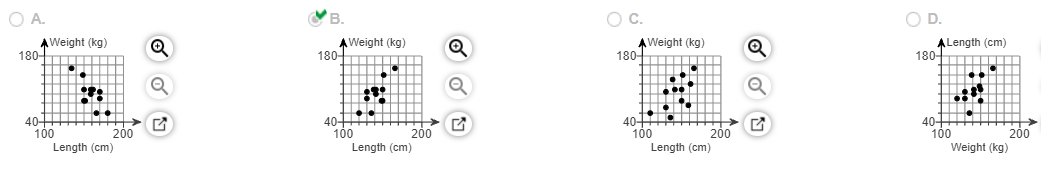
3. Draw a scatter diagram that might represent each relation.
minutes spent exercising on an elliptical and calories burned
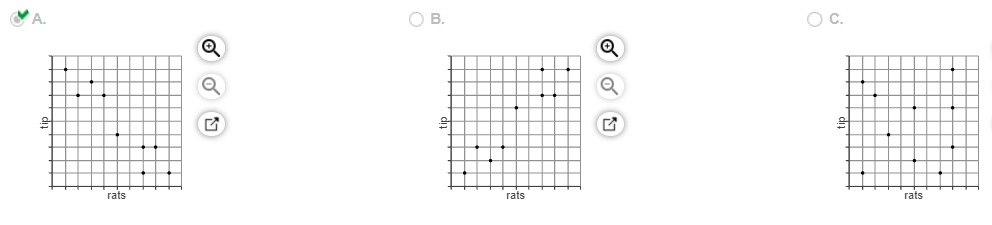
the number of rats at a restaurant and the size of the tip
Choose the most accurate scatter diagram below for the first relation.
Choose the most accurate scatter diagram below for the second relation.
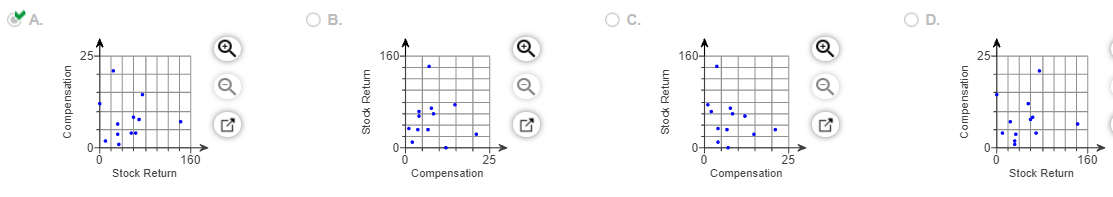
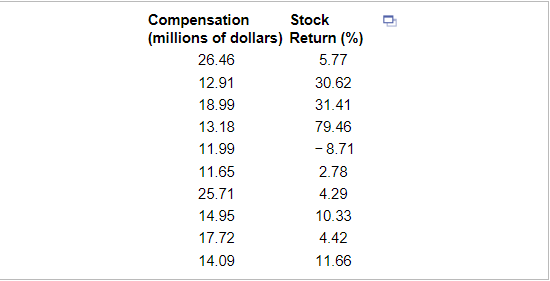
4. The accompanying data represent the total compensation for 12 randomly selected chief executive officers (CEO) and the company’s stock performance in a recent year. Complete parts (a) through (d) below.
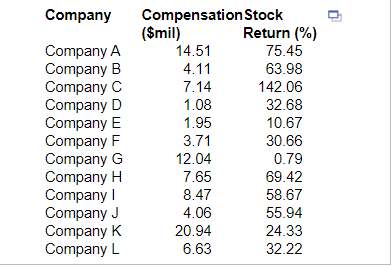
(a) One would think that a higher stock return would lead to a higher compensation. Based on this, what would likely be the explanatory variable?
- Compensation
- Stock return
(b) Draw a scatter diagram of the data. Use the result from part (a) to determine the explanatory variable. Choose the correct graph below.
(c) Determine the linear correlation coefficient between compensation and stock return.
r=
5 An engineer wants to determine how the weight of a gas-powered car, x, affects gas mileage, y. The accompanying data represent the weights of various domestic cars and their miles per gallon in the city for the most recent model year. Complete parts (a) through (d) below.
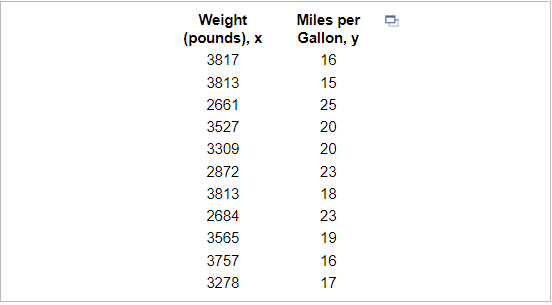
(a) Interpret the slope and y-intercept, if appropriate. Choose the correct answer below and fill in any answer boxes in your choice. (Use the answer from part a to find this answer.)
- For every pound added to the weight of the car, gas mileage in the city will decrease by ______ mile(s) per gallon, on average. It is not appropriate to interpret the y-intercept.
- A weightless car will get __________ miles per gallon, on average. It is not appropriate to interpret the slope.
- For every pound added to the weight of the car, gas mileage in the city will decrease by ______ mile(s) per gallon, on average. A weightless car will get _______ miles per gallon, on average.
- It is not appropriate to interpret the slope or the y-intercept.
(c) A certain gas-powered car weighs 3600 pounds and gets 16 miles per gallon. Is the miles per gallon of this car above average or below average for cars of this weight?
- Above
- Below
(d) Would it be reasonable to use the least-squares regression line to predict the miles per gallon of a hybrid gas and electric car? Why or why not?
- Yes, because the absolute value of the correlation coefficient is greater than the critical value for a sample size of n=11.
- No, because the hybrid is a different type of car.Your answer is correct.
- Yes, because the hybrid is partially powered by gas.
- No, because the absolute value of the correlation coefficient is less than the critical value for a sample size of n=11.
6. The given data represent the total compensation for 10 randomly selected CEOs and their company’s stock performance in 2009. Analysis of this data reveals a correlation coefficient of r=−0.2088.
What would be the predicted stock return for a company whose CEO made $15 million? What would be the predicted stock return for a company whose CEO made $25 million?
What would be the predicted stock return for a company whose CEO made $15 million? _______ (Type an integer or decimal rounded to one decimal place as needed.)
What would be the predicted stock return for a company whose CEO made $25 million? ________ (Type an integer or decimal rounded to one decimal place as needed.)
7. The data in the table to the right are based on the results of a survey comparing the commute time of adults to their score on a well-being test. Complete parts (a) through (d) below.
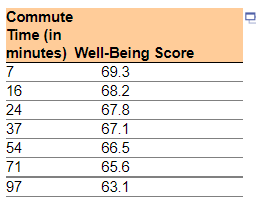
(a) Which variable is likely the explanatory variable and which is the response variable?
- The explanatory variable is commute time and the response variable is the well-being score because well-being score affects the commute time score.
- The explanatory variable is the well-being score and the response variable is commute time because commute time affects the well-being score.
- The explanatory variable is commute time and the response variable is the well-being score because commute time affects the well-being score.
- The explanatory variable is the well-being score and the response variable is commute time because well-being score affects the commute time.
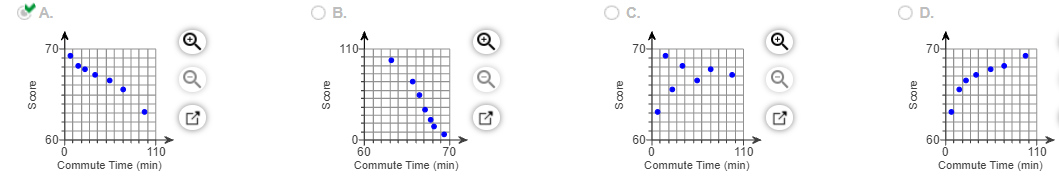
(b) Draw a scatter diagram of the data. Which of the following represents the data?
(c) Determine the linear correlation coefficient between commute time and well-being score.
r=
or chat with our tutors