
Navigation » List of Schools, Subjects, and Courses » Math 227 – Statistics » Quizzes » Chapter 3 Quiz
No Answers We dont have answer to this question yet. If you need help with your homework send us an email  or chat with our tutors
Chapter 3 Quiz
Chapter 3 Quiz
1. The histogram on the right represents the connection time in seconds to an internet provider. Determine which measure of central tendency better describes the “center” of the distribution.
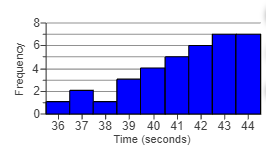
- Mean
- Median
- Mode
2. (a) Identify the shape of the distribution, and (b) determine the five-number summary. Assume that each number in the five-number summary is an integer.
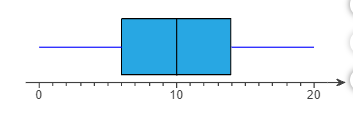
Choose the correct answer below for the shape of the distribution.
- The distribution is skewed left.
- The distribution is roughly symmetric.
- The distribution is skewed right.
- The shape of the distribution cannot be determined from the boxplot.
The five-number summary is __________________
3. Find the sample variance and standard deviation. 21, 10, 2, 6, 9
Choose the correct answer below. Fill in the answer box to complete your choice. (Type an integer or a decimal. Round to one decimal place as needed.)
- Sample variance =
- Standard deviation =
Choose the correct answer below. Fill in the answer box to complete your choice. (Round to one decimal place as needed.)
- Sample variance =
- Standard deviation =
4. The following data represent the amount of time (in minutes) a random sample of eight students took to complete the online portion of an exam in a particular statistics course. Compute the mean, median, and mode time.
62.1, 71.3, 90.4, 106.1, 128.4, 102.5, 94.7, 119.7
Compute the mean exam time. Select the correct choice below and, if necessary, fill in the answer box to complete your choice.
- The mean exam time is ______ (Round to two decimal places as needed.)
- The mean does not exist.
Compute the median exam time. Select the correct choice below and, if necessary, fill in the answer box to complete your choice.
- The median exam time is ______ (Round to two decimal places as needed.)
- The median does not exist.
Compute the mode exam time. Select the correct choice below and, if necessary, fill in the answer box to complete your choice.
- The mode is ______ (Round to two decimal places as needed. Use a comma to separate answers as needed.)
- The mode does not exist.
5. The data to the right represent the number of chocolate chips per cookie in a random sample of a name brand and a store brand. Complete parts (a) to (c) below.
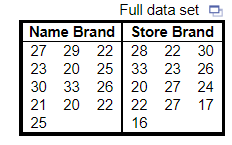
(a) Draw side-by-side boxplots for each brand of cookie. Label the boxplots “N” for the name brand and “S” for the store brand. Choose the correct answer below.
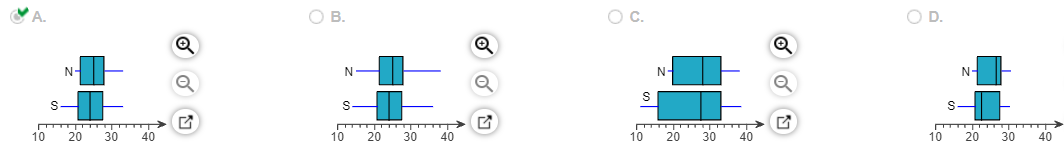
(b) Does there appear to be a difference in the number of chips per cookie?
- No. There appears to be no difference in the number of chips per cookie.
- Yes. The store brand appears to have more chips per cookie.
- Yes. The name brand appears to have more chips per cookie.
- There is insufficient information to draw a conclusion.
(c) Does one brand have a more consistent number of chips per cookie?
- Yes. The name brand has a more consistent number of chips per cookie.
- No. Both brands have roughly the same number of chips per cookie.
- Yes. The store brand has a more consistent number of chips per cookie.
- There is insufficient information to draw a conclusion.
6. A certain standardized test’s math scores have a bell-shaped distribution with a mean of 520 and a standard deviation of 105. Complete parts (a) through (c).
(a) What percentage of standardized test scores is between 415 and 625? ________ (Round to one decimal place as needed.)
(b) What percentage of standardized test scores is less than 415 or greater than 625? _______ (Round to one decimal place as needed.)
(c) What percentage of standardized test scores is greater than 730? _______ (Round to one decimal place as needed.)
7. Explain the circumstances for which the interquartile range is the preferred measure of dispersion. What is an advantage that the standard deviation has over the interquartile range?
Choose the correct answer below.
- The interquartile range is preferred when the data are skewed or have outliers. An advantage of the standard deviation is that it uses all the observations in its computation.
- The interquartile range is preferred when the data are bell shaped. An advantage of the standard deviation is that it increases as the dispersion of the data increases.
- The interquartile range is preferred when the data are not skewed or no have outliers. An advantage of the standard deviation is that it uses all the observations in its computation.
- The interquartile range is preferred when the data are bell shaped. An advantage of the standard deviation is that it is resistant to extreme values.
- The interquartile range is preferred when the distribution is symmetric. An advantage of the standard deviation is that it is resistant to extreme values.
- The interquartile range is preferred when the distribution is symmetric. An advantage of the standard deviation is that it increases as the dispersion of the data increases.
8. Twenty girls (ages 9-10) competed in the 50-meter freestyle event at a local swim meet. The mean time was 43.70 seconds with a standard deviation of 8.07 seconds. The median time was 40.15 with an IQR of 4.98 seconds. Without looking at a graphical display, what shape would you expect the distribution of swim times to have?
Choose the correct answer below.
- The distribution is likely to be symmetric since the mean is similar to the median and the IQR is considerably smaller than the standard deviation.
- The distribution is likely to be skewed to the right since the mean is greater than the median. The presence of outliers on the high end could explain the higher standard deviation and the greater mean.
- The distribution is likely to be skewed since the mean and median are different, but it is not possible to predict the direction of the skew.
- The distribution is likely to be skewed to the left since the mean is greater than the median. The presence of outliers on the low end could explain the fact that the IQR is smaller than the standard deviation.
9. Suppose babies born after a gestation period of 32 to 35 weeks have a mean weight of 3000 grams and a standard deviation of 1000 grams while babies born after a gestation period of 40 weeks have a mean weight of 3200 grams and a standard deviation of 435 grams. If a 33-week gestation period baby weighs 2700 grams and a 41-week gestation period baby weighs 2900 grams, find the corresponding z-scores. Which baby weighs less relative to the gestation period?
Find the corresponding z-scores. Which baby weighs relatively less?
Select the correct choice below and fill in the answer boxes to complete your choice. (Round to two decimal places as needed.)
- The baby born in week 33 weighs relatively less since its z-score, ________ is smaller than the z-score of _______ for the baby born in week 41.
- The baby born in week 41 weighs relatively less since its z-score, __________ is larger than the z-score of __________ for the baby born in week 33.
- The baby born in week 41 weighs relatively less since its z-score, _______ is smaller than the z-score of ________ for the baby born in week 33.
- The baby born in week 33 weighs relatively less since its z-score, _______ is largerthan the z-score of _______ for the baby born in week 41.
10. The weight of an organ in adult males has a bell-shaped distribution with a mean of 325 grams and a standard deviation of 30 grams. Use the empirical rule to determine the following.
(a) About 68% of organs will be between what weights?
(b) What percentage of organs weighs between 235 grams and 415 grams?
(c) What percentage of organs weighs less than 235 grams or more than 415 grams?(d) What percentage of organs weighs between 265 grams and 355 grams?
(a) _______ and ______ grams
(b) ______ (Type an integer or a decimal.)
(c) ________ (Type an integer or a decimal.)
(d) ___________ (Type an integer or decimal rounded to two decimal places as needed.)
11. Explain the meaning of the following percentiles in parts (a) and (b).
(a) The 10th percentile of the weight of males 36 months of age in a certain city is 11.0 kg.
(b) The 90th percentile of the length of newborn females in a certain city is 54.3 cm.
(a) Choose the correct answer below.
- 10% of males weigh 11.0 kg or less, and 90% of 36-month-old males weigh more than 11.0 kg.
- 10% of males weigh 11.0 kg or more, and 90% of 36-month-old males weigh less than 11.0 kg.
- 10% of 36-month-old males weigh 11.0 kg or more, and 90% of 36-month-old males weigh less than11.0 kg.
- 10% of 36-month-old males weigh 11.0 kg or less, and 90% of 36-month-old males weigh more than11.0 kg.
(b) Choose the correct answer below.
- 90% of newborn females have a length of 54.3 cm or less, and 10% of newborn females have a length that is more than 54.3 cm.
- 90% of females have a length of 54.3 cm or less, and 10% of newborn females have a length that is more than 54.3 cm.
- 90% of newborn females have a length of 54.3 cm or more, and 10% of newborn females have a length that is less than 54.3 cm.
- 90% of females have a length of 54.3 cm or more, and 10% of newborn females have a length that is less than 54.3 cm.
or chat with our tutors