Navigation » List of Schools, Subjects, and Courses » Math 120 – Introductory Probability and Statistics » Quizzes » Quiz 6
No Answers We dont have answer to this question yet. If you need help with your homework send us an email  or chat with our tutors
Quiz 6
Quiz 6
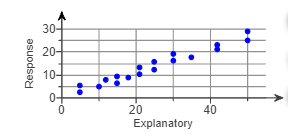
1. Determine whether the scatter diagram indicates that a linear relation may exist between the two variables. If the relation is linear, determine whether it indicates a positive or negative association between the variables.

Use this information to answer the following.
Do the two variables have a linear relationship?
- The data points do not have a linear relationship because they do not lie mainly in a straight line.
- The data points have a linear relationship because they do not lie mainly in a straight line.
- The data points have a linear relationship because they lie mainly in a straight line.
- The data points do not have a linear relationship because they lie mainly in a straight line.
Do the two variables have a positive or a negative association?
- The two variables have a positive association.
- The two variables have a negative association.
- None of the above
2. Draw a scatter diagram that might represent each relation.
hours spent studying a week and GPA
number of hours each week spent on social networking sites and GPA
Choose the most accurate scatter diagram below for the first relation.

Choose the most accurate scatter diagram below for the second relation.

3. Select the correct choices that complete the sentence below.
In a scatter diagram, the ________ variable is plotted on the horizontal axis and the _______ variable is plotted on the vertical axis.
4. What does it mean to say that two variables are positively associated? Negatively associated?
What does it mean to say that two variables are positively associated?
- There is a linear relationship between the variables, and whenever the value of one variable increases, the value of the other variable increases.
- There is a linear relationship between the variables.
- There is a relationship between the variables that is not linear.
- There is a linear relationship between the variables, and whenever the value of one variable increases, the value of the other variable decreases.
What does it mean to say that two variables are negatively associated?
- There is a linear relationship between the variables.
- There is a relationship between the variables that is not linear.
- There is a linear relationship between the variables, and whenever the value of one variable increases, the value of the other variable decreases.
- There is a linear relationship between the variables, and whenever the value of one variable increases, the value of the other variable increases.
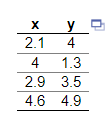
5. For the accompanying data set, (a) draw a scatter diagram of the data, (b) compute the correlation coefficient, and (c) determine whether there is a linear relation between x and y.

(a) Draw a scatter diagram of the data. Choose the correct graph below.

(b) Compute the correlation coefficient.
The correlation coefficient is r= ________ (Round to three decimal places as needed.)
(c) Determine whether there is a linear relation between x and y.
Because the correlation coefficient is _________ and the absolute value of the correlation coefficient, __________, is _______ than the critical value for this data set, _______ linear relation exists between x and y. (Round to three decimal places as needed.)
6. True or false: Correlation implies causation.
Choose the correct answer below.
- The statement is false. Correlation can only be used to imply causation as a result of a properly designed experiment.
- The statement is true. Correlation always implies causation.
- The statement is false. Correlation can only be used to imply causation as a result of an observational study.
- The statement is false. Correlation never implies causation.
7. Use the given data to complete parts (a) and (b) below.

(a) Draw a scatter diagram of the data. Choose the correct answer below.

Compute the linear correlation coefficient with the additional data point. The linear correlation coefficient for the five pieces of data is _______ (Round to three decimal places as needed.)
Comment on the effect the additional data point has on the linear correlation coefficient.
- The additional data point does not affect the linear correlation coefficient.
- The additional data point weakens the appearence of a linear association between the data points.
- The additional data point strengthens the appearence of a linear association between the data points.
Explain why correlations should always be reported with scatter diagrams.
- The scatter diagram is needed to see if the correlation coefficient is being affected by the presence of outliers.
- The scatter diagram is needed to determine if the correlation is positive or negative.
- The scatter diagram can be used to distinguish between association and causation.
8. Consider the data set given in the accompanying table. Complete parts (a) through (d).

(a) Determine the least-squares regression line. Choose the correct answer below.
- The least-squares regression line is y=1.6x+1.7.
- The least-squares regression line is y=1.5x+1.75.
- The least-squares regression line is y=1.7x+1.75.
- The least-squares regression line is y=1.7x+1.6.
(b) Graph the least-squares regression line on the scatter diagram. Choose the correct graph below.

 or chat with our tutors
