
Navigation » List of Schools, Subjects, and Courses » Math 227 – Statistics » Quizzes » Chapter 9 Quiz
With Answers Good news! We are showing you only an excerpt of our suggested answer to this question. Should you need our help in customizing an answer to this question, feel free to send us an email at  or chat with our customer service representative.
Chapter 9 Quiz
Chapter 9 Quiz
1. A trade magazine routinely checks the drive-through service times of fast-food restaurants. 80% confidence interval that results from examining 712 customers in one fast-food chain’s drive-through has a lower bound of 159.9 seconds and an upper bound of 163.5 seconds. What does this mean?
Choose the correct answer below.
- One can be 80% confident that the mean drive-through service time of this fast-food chain is 161.7 seconds.
- There is 80% probability that the mean drive-through service time of this fast-food chain is between 159.9 seconds and 163.5 seconds.
- The mean drive-through service time of this fast-food chain is 161.7 seconds 80% of the time.
- One can be 80% confident that the mean drive-through service time of this fast-food chain is between 159.9 seconds and 163.5 seconds.
2. The data shown to the right represent the age (in weeks) at which babies first crawl, based on a survey of mothers. Complete parts (a) through (c) below.
(a) Draw a normal probability plot to determine if it is reasonable to conclude the data come from a population that is normally distributed. Choose the correct answer below.
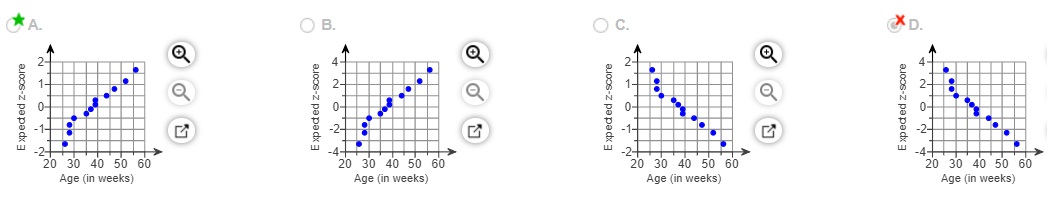
Is it reasonable to conclude that the data come from a population that is normally distributed?
- No, because the plotted values are not linear.
- Yes, because the plotted values are approximately linear.
- No, because there are not enough values to make a determination.
- Yes, because the plotted values are not linear.
(b) Draw a boxplot to check for outliers. Choose the correct answer below.
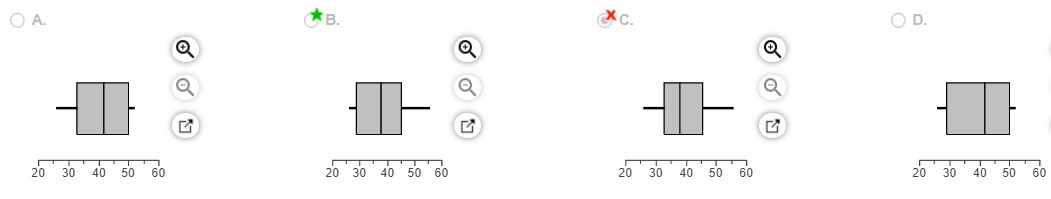
Does the boxplot suggest that there are outliers?
- Yes, there is at least one point that is greater than the third quartile or less than the first quartile.
- No, there are no points that are greater than the third quartile or less than the first quartile.
- Yes, there is at least one point that is outside of the 1.5(IQR) boundary.
- No, there are no points that are outside of the 1.5(IQR) boundary.
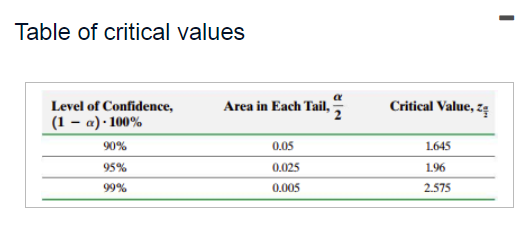
(c) Construct and interpret a % confidence interval for the mean age at which a baby first crawls. Select the correct choice and fill in the answer boxes to complete your choice. (Round to one decimal place as needed.)
- The lower bound is 32.2 weeks and the upper bound is 44.6 weeks. We are % confident that the mean age at which a baby first crawls is within the confidence interval.
- The lower bound is enter your response here weeks and the upper bound is enter your response here weeks. We are __ % confident that the mean age at which a baby first crawls is outside of the confidence interval.
3. A simple random sample of size 20 is drawn from a population that is known to be normally distributed. The sample variance is determined to be . Construct a 90% confidence interval for .
The lower bound is ___ (Round to two decimal places as needed.)
The upper bound is ____ (Round to two decimal places as needed.)
4. People were polled on how many books they read the previous year. Initial survey results indicate that s=14.5 books. Complete parts (a) through (d) below.
(a) How many subjects are needed to estimate the mean number of books read the previous year within 6 books with 90% confidence?
This 90% confidence level requires ___ subjects. (Round up to the nearest subject.)
(b) How many subjects are needed to estimate the mean number of books read the previous year within books 3 with 90% confidence?
This 90% confidence level requires ___ subjects. (Round up to the nearest subject.)
(c) What effect does doubling the required accuracy have on the sample size?
- Doubling the required accuracy nearly quadruples the sample size.
- Doubling the required accuracy nearly doubles the sample size.
- Doubling the required accuracy nearly quarters the sample size.
- Doubling the required accuracy nearly halves the sample size.
(d) How many subjects are needed to estimate the mean number of books read the previous year within 6 books with 99% confidence?
This 99% confidence level requires ____ subjects. (Round up to the nearest subject.)
Compare this result to part (a). How does increasing the level of confidence in the estimate affect sample size? Why is this reasonable?
- Increasing the level of confidence increases the sample size required. For a fixed margin of error, greater confidence can be achieved with a larger sample size.
- Increasing the level of confidence decreases the sample size required. For a fixed margin of error, greater confidence can be achieved with a smaller sample size.
- Increasing the level of confidence decreases the sample size required. For a fixed margin of error, greater confidence can be achieved with a larger sample size.
- Increasing the level of confidence increases the sample size required. For a fixed margin of error, greater confidence can be achieved with a smaller sample size.
5. A researcher wishes to estimate the proportion of adults who have high-speed Internet access. What size sample should be obtained if she wishes the estimate to be within 0.05 with 90% confidence if
(a) she uses a previous estimate of ?
(b) she does not use any prior estimates?
a. n=
b. n=
6. In a survey conducted by a reputable marketing agency, 231 of 1000 adults 19 years of age or older confessed to bringing and using their cell phone every trip to the bathroom (confessions included texting and answering phone calls). Complete parts (a) through (f) below.
(a) What is the sample in this study? What is the population of interest?
Determine the sample in this study. Select the correct choice below and, if necessary, fill in the answer box within your choice.
- The sample is all adults 19 years of age or older.
- The sample is the 1000 adults 19 years of age or older. (Type a whole number.)
- The sample is all adults with a cell phone.
- The sample is all adults.
Determine the population of interest. Select the correct choice below and, if necessary, fill in the answer box within your choice.
- The population is all adults with a cell phone.
- The population is all adults.
- The population is all adults 19 years of age or older.
- The population is the ___adults 19 years of age or older. (Type a whole number.)
(b) What is the variable of interest in this study? Is it qualitative or quantitative?
The variable of interest is _________ . This variable is _____________ because ______________________.
(d) Explain why the point estimate found in part (c) is a statistic. Explain why it is a random variable. What is the source of variability in the random variable?
Why is the point estimate found in part (c) a statistic?
- It is information obtained from a survey. ‘
- Its value may change depending on the individuals in the survey.
- It is being used to make inferences.
- The sample size is large.
- Its value is based on a sample.
Why is the point estimate found in part (c) a random variable?
- Its value is based on a sample.
- It is being used to make inferences.
- Its value may change depending on the individuals in the survey.
- It is information obtained from a survey.
- The sample size is large.
What is the source of variability in the random variable?
- The individuals selected to be in the study
- The sample size
- The question asked in the survey
- Random errors
7. Determine the t-value in each of the cases.
(a) Find the t-value such that the area in the right tail is with degrees of freedom. _____ (Round to three decimal places as needed.)
(b) Find the t-value such that the area in the right tail is with degrees of freedom. ______ (Round to three decimal places as needed.)
(c) Find the t-value such that the area left of the t-value is with degrees of freedom. [Hint: Use symmetry.] _____ (Round to three decimal places as needed.)
(d) Find the critical t-value that corresponds to % confidence. Assume degrees of freedom. ______ (Round to three decimal places as needed.)
8 A jar of peanuts is supposed to have 16 ounces of peanuts. The filling machine inevitably experiences fluctuations in filling, so a quality-control manager randomly samples 12 jars of peanuts from the storage facility and measures their contents. The data are in the table. Complete parts (a) through (d).
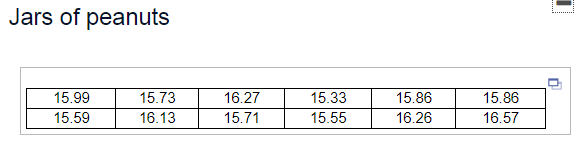
(a) Are the given data normally distributed? (Check by constructing a normal probability plot.)
- Yes
- No
(b) Determine the sample standard deviation.
The sample standard deviation is ______ (Round to three decimal places as needed.)
(c) Construct a 90% confidence interval for the population standard deviation of the number of ounces of peanuts.
The lower bound is _____ (Round to three decimal places as needed.)
The upper bound is _____ (Round to three decimal places as needed.)
(d) The quality control manager wants the machine to have a population standard deviation below ounce. Does the confidence interval validate this desire by indicating that the population standard deviation is below ?
- No
- Yes
9.