
Navigation » List of Schools, Subjects, and Courses » Math 138 – Statistics » Quizzes » Quiz 8
No Answers We dont have answer to this question yet. If you need help with your homework send us an email  or chat with our tutors
Quiz 8
Quiz 8
1. A t distribution with 9 degrees of freedom is graphed below. The region under the curve to the right of t=1.25 is shaded.
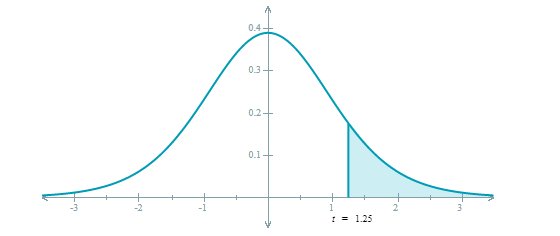
Find the area of the shaded region. Round your answer to three decimal places.
____
2. A notable indicator of a baby’s health is the weight gained in the first year of the baby’s life. Assume that the population of all such weight gains for baby girls is approximately normally distributed. A study claimed that the mean of this population is 3.218kg . As a practicing pediatrician, you want to test this claim. So, you select a random sample of 16 baby girls, and you record the weight each gained in their first year.
Follow the steps below to construct a 99% confidence interval for the population mean of all the weight gains for baby girls in their first year. Then state whether the confidence interval you construct contradicts the study’s claim. (If necessary, consult a list of formulas.)
3. Do pregnant women give birth the week of their due date? A study claims that 20% of the population of all pregnant women actually gave birth the week of their due date. You are a researcher who wants to test this claim, so you will select a random sample of 40 women who have recently given birth.
Follow the steps below to construct a 90% confidence interval for the population proportion of all pregnant women who gave birth the week of their due date. Then state whether the confidence interval you construct contradicts the study’s claim. (If necessary, consult a list of formulas.)
| Number | Proportion | |
| Gave birth the week of due date | 14 | 0.35 |
| Did not give birth the week of due date | 26 | 0.65 |
4. A researcher wishes to estimate the proportion of X-ray machines that malfunction. A random sample of 175 machines is taken, and 61 of the machines in the sample malfunction. Based upon this, compute a 90% confidence interval for the proportion of all X-ray machines that malfunction. Then find the lower limit and upper limit of the confidence interval.
Carry your intermediate computations to at least three decimal places. Round your answers to two decimal places. (If necessary, consult a list of formulas.)
______
5. A random sample of 175 adults was given an IQ test. It was found that 78 of them scored higher than 100 . Based on this, compute a 95% confidence interval for the proportion of all adults whose IQ score is greater than 100 . Then find the lower limit and upper limit of the 95% confidence interval.
Carry your intermediate computations to at least three decimal places. Round your answers to two decimal places. (If necessary, consult a list of formulas.)
_____
or chat with our tutors