
Navigation » List of Schools, Subjects, and Courses » Math 136 – Introduction to Statistics » Exams » Exam 3
No Answers We dont have answer to this question yet. If you need help with your homework send us an email  or chat with our tutors
Exam 3
Exam 3
1. To assess attitudes towards issues that affect the residents of a village, the village randomly chose 800 families to participate in a survey of life attitudes. The village received 628 completed surveys. What is the sample proportion of completed surveys?
- 0.628
- 1.274
- 0.886
- 0.785
2. Suppose a brewery has a filling machine that fills 12-ounce bottles of beer. It is known that the amount of beer poured by this filling machine follows a normal distribution with a mean of ounces and a standard deviation of 0.04 ounce. The company is interested in reducing the amount of extra beer that is poured into the 12 ounce bottles. The company is seeking to identify the highest 1.5% of the fill amounts poured by this machine. For what fill amount are they searching? Round to the nearest thousandth.
- 11.913 oz
- 12.087 oz
- 12.073 oz
- 12.247oz
3. A physical fitness association is including the mile run in its secondary-school fitness test. The time for this event for boys in secondary school is known to possess a normal distribution with a mean of seconds and a standard deviation of seconds. Find the probability that a randomly selected boy in secondary school can run the mile in less than seconds.
- 0.5107
- 0.4893
- 0.0107
- 0.9893
4. One year, professional sports players salaries averaged 1.8 million with a standard deviation of $0.8 million. Suppose a sample of 100 major league players was taken. Find the approximate probability that the average salary of the 100 players exceeded $1.1 million. Round to four decimal places.
- 0.7357
- approximately 1
- 0.2357
- approximately 0
5. What is the normal density curve symmetric about?
- Its mean
- The horizontal axis
- An inflection point
- A point located one standard deviation from the mean
6. Assume that the random variable X is normally distributed, with mean =110 and standard deviation = 20 Compute the probability P(X>126).
- 0.1977
- 0.2119
- 0.7881
- 0.2420
7. When 455 junior college students were surveyed, 110 said that they have previously owned a motorcycle. Find a point estimate for p, the population proportion of students who have previously owned a motorcycle. Round to the nearest thousandth.
- 0.242
- 0.195
- 0.319
- 0.758
8. Find the t-value such that the area in the right tail is 0.1 with 23 degrees of freedom.
- 68
- 2.5
- 1.319
- -1.319
9. Construct a 90% confidence interval for the population mean. Assume the population has a normal distribution. In a recent study of 22 eighth graders, the mean number of hours per week that they played video games was 19.6 with a standard deviation of 5.8 hours. Round to the nearest hundredth.
- (5.87, 7.98)
- (17.47, 21.73)
- (19.62, 23.12)
- (18.63, 20.89)
10. Suppose a 98% confidence interval for
turns out to be (1000, 2100). If this interval was based on a sample of size n=21, explain what assumptions are necessary for this interval to be valid.
- The population must have an approximately normal distribution.
- The population must have an approximate t-distribution.
- The sampling distribution of the sample mean must have a normal distribution.
- The sampling distribution must be biased with 20 degrees of freedom.
11 Approximately ____% of the area under the normal curve is between
.
- 68
- 99.7
- 50
- 95
12 Assume that blood pressure readings are normally distributed with a mean of 125 and a standard deviation of 8. If 100 people are randomly selected, find the probability that their mean blood pressure will be less than 127 . Round to four decimal places.
- 0.9938
- 0.9998
- 0.8615
- 0.0062
13. Construct a 95% t-interval about the population mean. Round to the nearest hundredth. Assume the data come from a population that is approximately normal with no outliers. The heights of 20- to 29-year-old females are known to have a population standard deviation
inches. A simple random sample of n=15 females 20 to 29 years old results in the accompanying data.
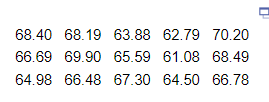
- (64.92, 67.78); It can be stated with 95% confidence that the mean height of 20- to 29-year-old females is between 64.92 and 67.77 inches.
- (65.20, 67.50); It can be stated with 95% confidence that the mean height of 20- to 29-year-old females is between 65.20 and 67.50 inches.
- (65.12, 67.58); It can be stated with 95% confidence that the mean height of 20- to 29-year-old females is between 65.12 and 67.58 inches.
- (64.85, 67.85); It can be stated with 95% confidence that the mean height of 20- to 29-year-old females is between 64.85 and 67.85 inches.
14 Smith is a weld inspector at a shipyard. He knows from keeping track of good and substandard welds that for the afternoon shift, 5% of all welds done will be substandard. If Smith checks 300 of the 7500 welds completed that shift, what is the probability that he will find less than 20 substandard welds? Round to four decimal places.
- 0.5934
- 0.4066
- 0.0934
- 0.9066
15 Suppose a brewery has a filling machine that fills 12 ounce bottles of beer. It is known that the amount of beer poured by this filling machine follows a normal distribution with a mean of 12.15 ounces and a standard deviation of 0.04 ounce. Find the probability that the bottle contains between 12.05 and 12.11 ounces.
- 0.8351
- 0.1649
- 0.1525
- 0.8475
16. Assume that the random variable X is normally distributed, with mean
and standard deviation
Compute the probability P(X<110).
- 0.8849
- 0.9015
- 0.8944
- 0.1056
17. The principal at Riverside High School would like to estimate the mean length of time each day that it takes all the buses to arrive and unload the students. How large a sample is needed if the principal would like to assert with 90% confidence that the sample mean is off by, at most, 7 minutes. Assume that s=14 minutes based on previous studies.
- 7
- 10
- 12
- 11
18. The amount of corn chips dispensed into a 16-ounce bag by the dispensing machine has been identified as possessing a normal distribution with a mean of 16.5 ounces and a standard deviation of 0.2 ounces. Suppose 100 bags of chips were randomly selected from this dispensing machine. Find the probability that the sample mean weight of these 100 bags exceeded 16.6 ounces. Round to four decimal places.
- approximately 0
- 0.3085
- 0.1915
- 0.6915
19. Fill in the blank. According to the law of large numbers, as more observations are added to the sample, the difference between the sample mean and the population mean _______.
- is inversely affected by the data added
- tends to become smalle
- remains about the same
- tends to become larger
20. A national caterer determined that 87% of the people who sampled their food said that it was delicious. A random sample of 144 people is obtained from a population of 5000. The 144 people are asked to sample the caterer’s food. If
is the sample proportion saying that the food is delicious, what is the mean of the sampling distribution of
?
- 1.25
- 0.42
- 0.87
- 0.19
21. Determine the sample size required to estimate the mean score on a standardized test within 2 points of the true mean with 98% confidence. Assume that s =14 based on earlier studies.
- 267
- 17
- 370
- 1
22. In a random sample of 60 dog owners enrolled in obedience training, it was determined that the mean amount of money spent per owner was $109.33 per class and the standard deviation of the amount spent per owner was $12. Construct and interpret a 95% confidence interval for the mean amount spent per owner for an obedience class. Round to the nearest cent.
- ($106.74,$111.92); It can be stated with 95% confidence that the mean amount spent per dog owner for a single obedience class is between $106.74 and $111.92
- ($106.78,$111.88); It can be stated with 95% confidence that the mean amount spent per dog owner for a single obedience class is between $106.78 and $111.88.
- ($105.20,$113.45); It can be stated with 95% confidence that the mean amount spent per dog owner for a single obedience class is between $105.20 and $113.45.
- ($106.23,$112.43); It can be stated with 95% confidence that the mean amount spent per dog owner for a single obedience class is between $106.23 and $112.43.
23 A senator wishes to estimate the proportion of United States voters who favor abolishing the Electoral College. How large a sample is needed in order to be 95% confident that the sample proportion will not differ from the true proportion by more than 3%?
- 752
- 17
- 2,135
- 1,068
24. Construct a 95% confidence interval for the population mean, . Assume the population has a normal distribution. A sample of 20 part-time workers had mean annual earnings of $3120 with a standard deviation of $677. Round to the nearest dollar.
- ($2657, $2891)
- ($2135, $2567)
- ($2803, $3437)
- ($1324, $1567)
25. A researcher wishes to estimate the number of households with two computers. How large a sample is needed in order to be 98% confident that the sample proportion will not differ from the true proportion by more than 6%? A previous study indicates that the proportion of households with two computers is 25%.
- 201
- 5
- 378
- 283
26. A new phone system was installed last year to help reduce the expense of personal calls that were being made by employees. Before the new system was installed, the amount being spent on personal calls followed a normal distribution with an average of $800 per month and a standard deviation of $50 per month. Refer to such expenses as PCE’s (personal call expenses). Using the distribution above, what is the probability that a randomly selected month had a PCE of between $675 and $890?
- 0.0421
- 0.0001
- 0.9579
- 0.9999
27. For a standard normal curve, find the z-score that separates the bottom 90% from the top 10%.
- 1.28
- 0.28
- 1.52
- 2.81
28. The grade point averages for 10 randomly selected junior college students are listed below. Assume the grade point averages are normally distributed. Find a 98% confidence interval for the true mean. Round to the nearest hundredth.
2.0 3.2 1.8 2.9 0.9 4.0 3.3 2.9 3.6 0.8
- (3.11, 4.35)
- (1.55, 3.53)
- (0.67, 1.81)
- (2.12, 3.14)
29. A physical fitness association is including the mile run in its secondary-school fitness test. The time for this event for boys in secondary school is known to possess a normal distribution with a mean of 470 seconds and a standard deviation of 60 seconds. Between what times do we expect most (approximately 95%) of the boys to run the mile?
- between 352.4 and 587.6 sec
- between 375 and 565 sec
- between 371.3 and 568.736 sec
- between 0 and 568.736 sec
30. A group of realtors estimates that 23% of all homes purchased last year were considered investment properties. If a sample of 800 homes sold last year is obtained, what is the probability that between 175 and 200 homes are going to be used as investment property? Round to four decimal places.
- 0.9099
- 0.1335
- 0.6863
- 0.2236
31. A confidence interval was used to estimate the proportion of math majors that are female. A random sample of 72 math majors generated the confidence interval (0.438, 0.642). Using the information above, what size sample would be necessary to estimate the true proportion to within 2% using 95% reliability?
- 2,305
- 2,498
- 2,401
- 2,386
32 Find the area under the standard normal curve to the right of z = 1.
- 0.5398
- 0.8413
- 0.1587
- 0.1397
33. The tread life of a particular brand of tire is a random variable best described by a normal distribution with a mean of 60,000 miles and a standard deviation of 1,300 miles. What is the probability a particular tire of this brand will last longer than 58,700 miles?
- 0.7266
- 0.1587
- 0.8413
- 0.2266
34. Determine whether the graph can represent a normal curve. If it cannot, explain why.
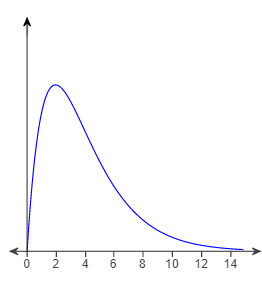
- The graph can represent a normal density function.
- The graph cannot represent a normal density function because it is bimodal.
- The graph cannot represent a normal density function because it is not symmetric.
- The graph cannot represent a normal density function because as x increases without bound, the graph takes negative values.
35. Compare a graph of the normal density function with a mean of 0 and standard deviation of 1 with a graph of a normal density function with a mean equal to 0 and standard deviation of 0.5.
- There would be no horizontal displacement, but the graph with a standard deviation of 1 would be steeper than the other.
- There would be no horizontal displacement, but the graph with a standard deviation of 1 would be flatter than the other.
- The graphs would have the same height, but the graph with a standard deviation of 1 would be shifted 4 units to the left.
- The graphs would have the same height, but the graph with a standard deviation of 1 would be shifted 4 units to the right.
36. A survey of 1010 college seniors working towards an undergraduate degree was conducted. Each student was asked, “Are you planning or not planning to pursue a graduate degree?” Of the 1010 surveyed, 658 stated that they were planning to pursue a graduate degree. Construct and interpret a 98% confidence interval for the proportion of college seniors who are planning to pursue a graduate degree. Round to the nearest thousandth.
- (0.612,0.690); It can be stated with 98% confidence that the proportion of college seniors who are planning to pursue a graduate degree is between 0.612 and 0.690.
- (0.620,0.682); It can be stated with 98% confidence that the proportion of college seniors who are planning to pursue a graduate degree is between 0.620 and 0.682.
- (0.621,0.680); It can be stated with 98% confidence that the proportion of college seniors who are planning to pursue a graduate degree is between 0.621 and 0.680.
- (0.616,0.686); It can be stated with 98% confidence that the proportion of college seniors who are planning to pursue a graduate degree is between 0.616 and 0.686.
37. An article a newspaper reported on the topics that teenagers most want to discuss with their parents. The findings, the results of a poll, showed that 46% would like more discussion about the family’s financial situation, 37% would like to talk about school, and 30% would like to talk about religion. These and other percentages were based on a national sampling of teenagers. Estimate the proportion of all teenagers who want more family discussions about school. Use a 99% confidence level. Express the answer in the form
E and round to the nearest thousandth.
or chat with our tutors