
Navigation » List of Schools, Subjects, and Courses » Math 136 – Introduction to Statistics » Quiz » Quiz 7
No Answers We dont have answer to this question yet. If you need help with your homework send us an email  or chat with our tutors
Quiz 7
Quiz 7
1. Suppose the null hypothesis is not rejected. State the conclusion based on the results of the test.
Six years ago, 12.8% of registered births were to teenage mothers. A sociologist believes that the percentage has increased since then.
Which of the following is the correct conclusion?
- There is not sufficient evidence to conclude that the percentage of teenage mothers has remained the same.
- There is sufficient evidence to conclude that the percentage of teenage mothers has remained the same.
- There is not sufficient evidence to conclude that the percentage of teenage mothers has increased.
- There sufficient evidence to conclude that the percentage of teenage mothers has increased.
2. Fill in the blank to complete the statement.
If we do not reject the null hypothesis when the statement in the alternative hypothesis is true, we have made a Type _______ error.
3. Fill in the blanks to complete the statement.
The _______ _______ is a statement of no change, no effect or no difference
4. Explain what a P-value is. What is the criterion for rejecting the null hypothesis using the P-value approach?
Explain what a P-value is. Choose the correct answer below.
- A P-value is the number of standard deviations that the observed proportion is from the proportion stated in the null hypothesis.
- A P-value is the probability of observing a sample statistic as extreme or more extreme than the one observed under the assumption that the statement in the null hypothesis is true.
- A P-value is the value used to designate the area in either the left- or right-tail of the normal curve.
- What is the criterion for rejecting the null hypothesis using the P-value approach?
5. The null and alternative hypotheses are given. Determine whether the hypothesis test is left-tailed, right-tailed, or two-tailed. What parameter is being tested?
Is the hypothesis test left-tailed, right-tailed, or two-tailed?
- Left-tailed test
- Two-tailed test
- Right-tailed test
What parameter is being tested?
- Population proportion
- Population standard deviation
- Population mean
6. Suppose the null hypothesis is rejected. State the conclusion based on the results of the test.
Three years ago, the mean price of a single-family home was $243,788. A real estate broker believes that the mean price has increased since then.
Which of the following is the correct conclusion?
- There is not sufficient evidence to conclude that the mean price of a single-family home has not changed.
- There is not sufficient evidence to conclude that the mean price of a single-family home has increased.
- There is sufficient evidence to conclude that the mean price of a single-family home has not changed.
- There is sufficient evidence to conclude that the mean price of a single-family home has increased.
7. The null and alternative hypotheses are given. Determine whether the hypothesis test is left-tailed, right-tailed, or two-tailed. What parameter is being tested?
Is the hypothesis test left-tailed, right-tailed, or two-tailed?
- Left-tailed test
- Two-tailed test
- Right-tailed test
What parameter is being tested?
- Population proportion
- Population standard deviation
- Population mean
8. This past year, an organization conducted a survey and asked, “What do you think is the ideal number of children for a family to have?” The results of the survey are shown in the table. Complete parts (a) through (e).
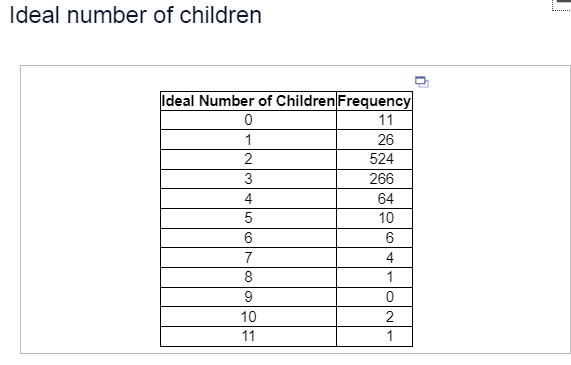
Comment on the shape of the distribution. Choose the correct answer below.
- The distribution is symmetric.
- The distribution is uniform.
- The distribution is skewed left.
- The distribution is skewed right.
(b) What is the mode ideal number of children? Select the correct choice and, if necessary, fill in the answer box to complete your answer.
- The mode ideal number of children is _____(Use a comma to separate answers as needed.)
- There is no mode.
(c) Determine the mean number of children.
The mean number of children is _____ (Round to two decimal places as needed.)
Determine the standard deviation number of children.
The standard deviation number of children is ____ (Round to two decimal places as needed.)
(d) Explain why a large sample size is needed to perform any inference regarding this population. Choose the correct answer below.
- The standard deviation is less than the mode.
- The data are symmetric.
- The mean number is greater than the standard deviation.
- The data are clearly skewed to the right.
9. For students who first enrolled in two year public institutions in a recent semester, the proportion who earned a bachelor’s degree within six years was 0.388. The president of a certain college believes that the proportion of students who enroll in her institution have a completion rate.
(a) Determine the null and alternative hypotheses.
(b) Explain what it would mean to make a Type I error.
(c) Explain what it would mean to make a Type II error.
(a) State the Hypotheses
(b) Which of the following is a Type I error?
- The president fails to reject the hypothesis that the proportion of students who earn a bachelor’s degree within six years is 0.388, when, in fact, the proportion is 0.388.
- The president rejects the hypothesis that the proportion of students who earn a bachelor’s degree within six years is 0.388, when, in fact, the proportion is greater than 0.388.
- The president rejects the hypothesis that the proportion of students who earn a bachelor’s degree within six years is 0.388, when, in fact, the proportion is 0.388.
- The president fails to reject the hypothesis that the proportion of students who earn a bachelor’s degree within six years is 0.388, when, in fact, the proportion is greater than 0.388.
(c) Which of the following is a Type II error?
- The president fails to reject the hypothesis that the proportion of students who earn a bachelor’s degree within six years is 0.388, when, in fact, the proportion is 03.88.
- The president rejects the hypothesis that the proportion of students who earn a bachelor’s degree within six years is 0.388 , when, in fact, the proportion is greater than 0.388.
- The president fails to reject the hypothesis that the proportion of students who earn a bachelor’s degree within six years is 0.388, when, in fact, the proportion is greater than 0.388.
- The president rejects the hypothesis that the proportion of students who earn a bachelor’s degree within six years is 0.388, when, in fact, the proportion is 0.388.
10. If a hypothesis is tested at the
0.05 level of significance, what is the probability of making a type I error?
Choose the correct answer below.
- The probability of making a type I error is 0.05.
- The probability of making a type I error is 0.5.
- The probability of making a type I error is 0.95.
- There is insufficient information to determine the probability of a type I error.
11. Three years ago, the mean price of an existing single-family home was $243,713. A real estate broker believes that existing home prices in her neighborhood are higher.
(a) Determine the null and alternative hypotheses.
(b) Explain what it would mean to make a Type I error.
(c) Explain what it would mean to make a Type II error.
(a) State the hypotheses.
(b) Which of the following is a Type I error?
- The broker fails to reject the hypothesis that the mean price is $243,713, when the true mean price is greater than $243,713
- The broker rejects the hypothesis that the mean price is $243,713, when the true mean price is greater than $243,713
- The broker fails to reject the hypothesis that the mean price is $243,713, when it is the true mean cost.
- The broker rejects the hypothesis that the mean price is $243,713, when it is the true mean cost.
(c) Which of the following is a Type II error?
- The broker fails to reject the hypothesis that the mean price is $243,713, when the true mean price is greater than $243,713
- The broker fails to reject the hypothesis that the mean price is $243,713, when it is the true mean cost.
- The broker rejects the hypothesis that the mean price is $243,713, when the true mean price is greater than $243,713
- The broker rejects the hypothesis that the mean price is $243,713, when it is the true mean cost.
12. Explain what it means to make a Type II error.
Choose the correct answer below.
- Fail to reject the null hypothesis and the alternative is true.
- Reject the null hypothesis and the null is true.
- Reject the null hypothesis and the alternative is true.
- Fail to reject the null hypothesis and the null is true.
or chat with our tutors