
Navigation » List of Schools, Subjects, and Courses » Math 136 – Introduction to Statistics » Quiz » Quiz 6
No Answers We dont have answer to this question yet. If you need help with your homework send us an email  or chat with our tutors
Quiz 6
Quiz 6
1. One graph in the figure represents a normal distribution with mean
and standard deviation
. The other graph represents a normal distribution with mean
and standard deviation
. Determine which graph is which and explain how you know.
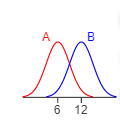
A graph has a horizontal axis with two tick marks labeled “6” and “12” from left to right. The normal curve labeled “A” is slightly above the horizontal axis at the left edge of the graph, rises from left to right at an increasing and then decreasing rate to its peak at 6 and then falls from left to right at an increasing and then decreasing rate to the horizontal axis about one quarter from the right edge of the graph. The normal curve labeled “B” is slightly above the horizontal axis about one quarter from the left edge of the graph, rises from left to right at an increasing and then decreasing rate to its peak at 12 and then falls from left to right at an increasing and then decreasing rate to the horizontal axis at the right edge of the graph.
Choose the correct answer below.
- Graph A has a mean of
and graph B has a mean of
because a larger mean shifts the graph to the left.
- Graph A has a mean of
and graph B has a mean of
because a larger mean shifts the graph to the left.
- Graph A has a mean of
and graph B has a mean of
because a larger mean shifts the graph to the right.
- Graph A has a mean of
and graph B has a mean of
because a larger mean shifts the graph to the right.
2. Fill in the blanks to correctly complete the sentence below.
Suppose a simple random sample of size n is drawn from a large population with mean
and standard deviation
. The sampling distribution of
has mean
______ and standard deviation
= ______.
3. Find the Z-score such that the area under the standard normal curve to the right is 0.42.
The approximate Z-score that corresponds to a right tail area of 0.42 is _____
4. Complete the sentence below.
The _____ _____, denoted
, is given by the formula
_____, where x is the number of individuals with a specified characteristic in a sample of n individuals.
5. The lengths of a particular animal’s pregnancies are approximately normally distributed, with mean
days and standard deviation
days.
(a) What proportion of pregnancies lasts more than 279 days?
(b) What proportion of pregnancies lasts between 264 and 273 days?
(c) What is the probability that a randomly selected pregnancy lasts no more than 267 days?
(d) A “very preterm” baby is one whose gestation period is less than 243 days. Are very preterm babies unusual?
(a) The proportion of pregnancies that last more than 279 days is _____ (Round to four decimal places as needed.)
(b) The proportion of pregnancies that last between 264 and 273 days is _____(Round to four decimal places as needed.)
(c) The probability that a randomly selected pregnancy lasts no more than 267 days is _____ (Round to four decimal places as needed.)
(d) A “very preterm” baby is one whose gestation period is less than 243 days. Are very preterm babies unusual?
The probability of this event is _____, so it ____ be unusual because the probability is _____ than 0.05. (Round to four decimal places as needed.)
6. Find the Z-score such that the area under the standard normal curve to the left is 0.52 .
___ is the Z-score such that the area under the curve to the left is 0.52.
7. Determine whether the following graph can represent a normal density function.
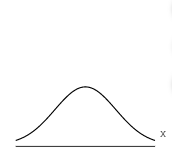
Could the graph represent a normal density function?
- No
- Yes
8. The mean gas mileage for a hybrid car is 57 miles per gallon. Suppose that the gasoline mileage is approximately normally distributed with a standard deviation of 3.5 miles per gallon. (a) What proportion of hybrids gets over 65 miles per gallon? (b) What proportion of hybrids gets 50 miles per gallon or less? proportion of hybrids gets between 59 and 62 miles per gallon? (d) What is the probability that a randomly selected hybrid gets less than 45 miles per gallon?
(a) The proportion of hybrids that gets over 61 miles per gallon is ____ (Round to four decimal places as needed.)
(b) The proportion of hybrids that gets 50 miles per gallon or less is ____ (Round to four decimal places as needed.)
(c) The proportion of hybrids that gets between 59 and 62 miles per gallon is ____ (Round to four decimal places as needed.)
(d) The probability that a randomly selected hybrid gets less than 45 miles per gallon is _____ (Round to four decimal places as needed.)
9. Fill in the blank to complete the statement.
The notation
is the z-score that the area under the standard normal curve to the right of
is _______.
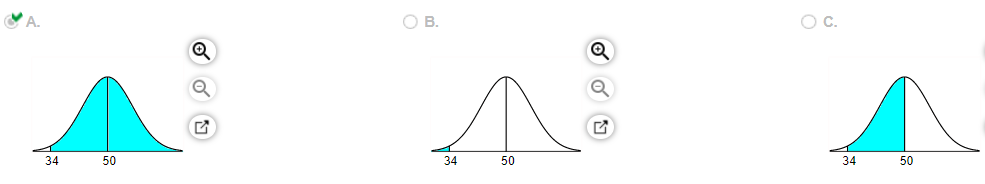
10. Assume the random variable X is normally distributed with mean
and standard deviation
. Compute the probability. Be sure to draw a normal curve with the area corresponding to the probability shaded.
Which of the following normal curves corresponds to
?
11. The graph of a normal curve is given. Use the graph to identify the value of
and
.

The value of
is___
The value of
12. A simple random sample of size n = 49 is obtained from a population with
and
. Does the population need to be normally distributed for the sampling distribution of
to be approximately normally distributed? Why? What is the sampling distribution of
?
Does the population need to be normally distributed for the sampling distribution of
to be approximately normally distributed? Why?
- Yes because the Central Limit Theorem states that the sampling variability of nonnormal populations will increase as the sample size increases.
- No because the Central Limit Theorem states that regardless of the shape of the underlying population, the sampling distribution of becomes approximately normal as the sample size, n, increases.
- Yes because the Central Limit Theorem states that only for underlying populations that are normal is the shape of the sampling distribution of normal, regardless of the sample size, n.
- No because the Central Limit Theorem states that only if the shape of the underlying population is normal or uniform does the sampling distribution of become approximately normal as the sample size, n, increases.
13. According to a study conducted by a statistical organization, the proportion of people who are satisfied with the way things are going in their lives is 0.80 . Suppose that a random sample of 100 people is obtained. Complete parts (a) through (e) below.
(a) Suppose the random sample of people is asked, “Are you satisfied with the way things are going in your life?” Is the response to this question qualitative or quantitative? Explain.
- The response is quantitative because the number of people satisfied can be counted.
- The response is quantitative because the responses can be classified based on the characteristic of being satisfied or not.
- The response is qualitative because the responses can be classified based on the characteristic of being satisfied or not.
- The response is qualitative because the number of people satisfied can be counted.
(b) Explain why the sample proportion,
, is a random variable. What is the source of the variability?
- The sample proportion
is a random variable because the value of
varies from sample to sample. The variability is due to the fact that people may not be responding to the question truthfully.
- The sample proportion
is a random variable because the value of
varies from sample to sample. The variability is due to the fact that different people feel differently regarding their satisfaction.
- The sample proportion
is a random variable because the value of
represents a random person included in the sample. The variability is due to the fact that different people feel differently regarding their satisfaction.
- The sample proportion
is a random variable because the value of
represents a random person included in the sample. The variability is due to the fact that people may not be responding to the question truthfully.
14. The mean incubation time of fertilized eggs is 21 days. Suppose the incubation times are approximately normally distributed with a standard deviation of 1 day.
(a) Determine the 10th percentile for incubation times.
(b) Determine the incubation times that make up the middle 39%.
(a) The th percentile for incubation times is ____ days. (Round to the nearest whole number as needed.)
(b) The incubation times that make up the middle 39% are ___ to ____ days. Round to the nearest whole number as needed. Use ascending order.)
15. Is the statement below true or false? The mean of the sampling distribution of
is p.
Choose the correct answer below.
- True
- False
16. Suppose the lengths of the pregnancies of a certain animal are approximately normally distributed with mean
and standard deviation
days . Complete parts (a) through (f) below.
(a) What is the probability that a randomly selected pregnancy lasts less than 238 days?
The probability that a randomly selected pregnancy lasts less than 238 days is approximately _____. (Round to four decimal places as needed.)
Interpret this probability. Select the correct choice below and fill in the answer box within your choice. (Round to the nearest integer as needed.)
- If 100 pregnant individuals were selected independently from this population, we would expect ___ pregnancies to last more than 238 days.
- If 100 pregnant individuals were selected independently from this population, we would expect 37 pregnancies to last less than 238 days.
- If 100 pregnant individuals were selected independently from this population, we would expect __ pregnancies to last exactly 238 days.
(b) Suppose a random sample of 20 pregnancies is obtained. Describe the sampling distribution of the sample mean length of pregnancies.
The sampling distribution of
is _____ with
and
_____ (Round to four decimal places as needed.)
(c) What is the probability that a random sample of 20 pregnancies has a mean gestation period of 238 days or less?
The probability that the mean of a random sample of 20 pregnancies is less than 238 days is approximately _____ (Round to four decimal places as needed.)
17. Find the value of
18. Assume that the random variable X is normally distributed, with mean
and standard deviation
. Compute the probability. Be sure to draw a normal curve with the area corresponding to the probability shaded.
Which of the following shaded regions corresponds to

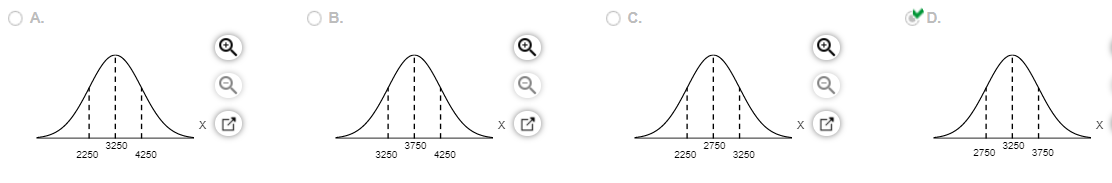
19. Suppose the birth weights of full-term babies are normally distributed with mean 3250 grams and standard deviation
grams. Complete parts (a) through (c) below.
(a) Draw a normal curve with the parameters labeled. Choose the correct graph below.
(b) Shade the region that represents the proportion of full-term babies who weigh than grams. Choose the correct graph below.
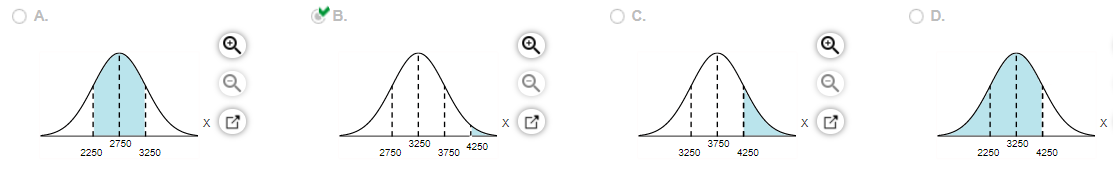
(c) Suppose the area under the normal curve to the of X = 4250 is 0.0228. Provide an interpretation of this result. Select the correct choice below and fill in the answer box to complete your choice. (Type a whole number.)
- The probability is 0.0228 that the birth weight of a randomly chosen full-term baby in this population is less than _____
- The probability is 0.0228 that the birth weight of a randomly chosen full-term baby in this population is more than _____ grams.
20. Fill in the blank to complete the statement.
The area under the normal curve to the right of
equals _______.
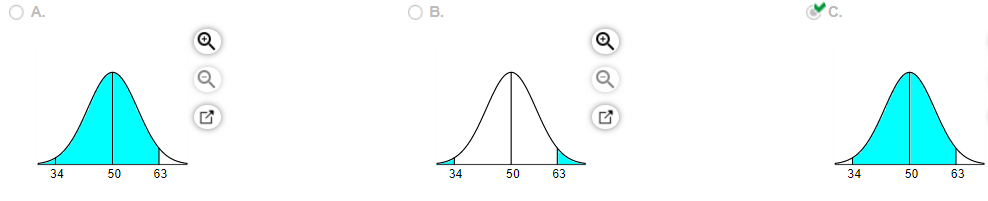
21. Assume the random variable X is normally distributed with mean
and standard deviation
. Compute the probability. Be sure to draw a normal curve with the area corresponding to the probability shaded.
Which of the following normal curves corresponds to ?
22. Is the statement below true or false?
The distribution of the sample mean,
, will be normally distributed if the sample is obtained from a population that is normally distributed, regardless of the sample size.
Choose the correct answer below.
- False
- True
or chat with our tutors