
Navigation » List of Schools, Subjects, and Courses » Math 136 – Introduction to Statistics » Quiz » Quiz 5
No Answers We dont have answer to this question yet. If you need help with your homework send us an email  or chat with our tutors
Quiz 5
Quiz 5
1. Find the Z-score such that the area under the standard normal curve to the left is 0.52.
____ is the Z-score such that the area under the curve to the left is .
2. Find the value of
.
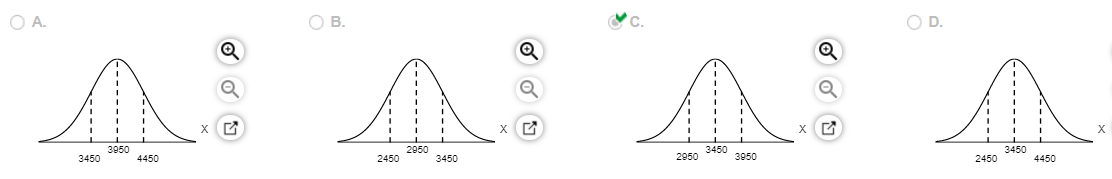
3. Suppose the birth weights of full-term babies are normally distributed with mean 3450 grams and standard deviation
. Complete parts (a) through (c) below.
(a) Draw a normal curve with the parameters labeled. Choose the correct graph below.
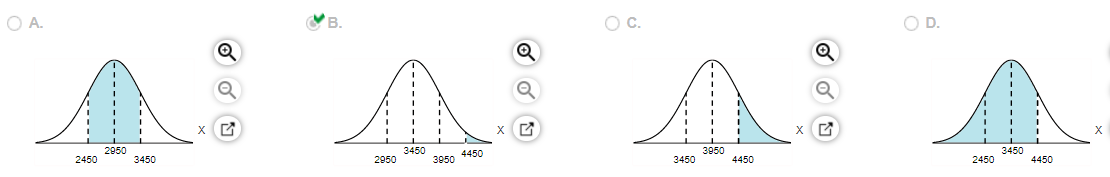
(b) Shade the region that represents the proportion of full-term babies who weigh more than 4450 grams. Choose the correct graph below.
(c) Suppose the area under the normal curve to the of X = 4450 is 0.0228. Provide an interpretation of this result. Select the correct choice below and fill in the answer box to complete your choice. (Type a whole number.)
- The probability is 0.0228 that the birth weight of a randomly chosen full-term baby in this population is less than ___ grams.
- The probability is 0.0228 that the birth weight of a randomly chosen full-term baby in this population is more than ____ grams.
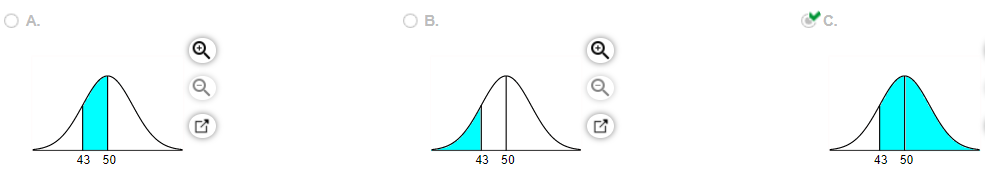
4. Assume that the random variable X is normally distributed, with mean
and standard deviation
. Compute the probability. Be sure to draw a normal curve with the area corresponding to the probability shaded.
Which of the following shaded regions corresponds to
=
5. The graph of a normal curve is given. Use the graph to identify the value of and .
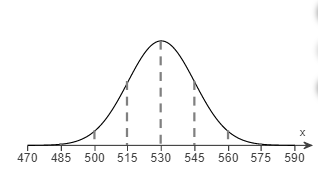
The value of
is
The value of
is
6. The lengths of a particular animal’s pregnancies are approximately normally distributed, with mean
260 days and standard deviation
days.
(a) What proportion of pregnancies lasts more than 280 days?
(b) What proportion of pregnancies lasts between 252 and 272 days?
(c) What is the probability that a randomly selected pregnancy lasts no more than 256 days?
(d) A “very preterm” baby is one whose gestation period is less than 220 days. Are very preterm babies unusual?
(a) The proportion of pregnancies that last more than 280 days is _____ Round to four decimal places as needed.)
(b) The proportion of pregnancies that last between 252 and 272 days is _____ (Round to four decimal places as needed.)
(c) The probability that a randomly selected pregnancy lasts no more than days is ____ (Round to four decimal places as needed.)
(d) A “very preterm” baby is one whose gestation period is less than 220 days. Are very preterm babies unusual?
The probability of this event is ____ 0.0062, so it ____ be unusual because the probability is ___ than 0.05. (Round to four decimal places as needed.)
7. Fill in the blank to complete the statement.
The notation
is the z-score that the area under the standard normal curve to the right of
is _______.
8. One graph in the figure represents a normal distribution with mean
and standard deviation
. The other graph represents a normal distribution with mean
and standard deviation
. Determine which graph is which and explain how you know.
Choose the correct answer below.
- Graph A has a mean of
and graph B has a mean of
because a larger mean shifts the graph to the left.
- Graph A has a mean of
and graph B has a mean of
because a larger mean shifts the graph to the right.
- Graph A has a mean of
and graph B has a mean of
because a larger mean shifts the graph to the right.
- Graph A has a mean of
and graph B has a mean of
because a larger mean shifts the graph to the left.
9. Assume the random variable X is normally distributed with mean
and standard deviation
. Compute the probability. Be sure to draw a normal curve with the area corresponding to the probability shaded.
Which of the following normal curves corresponds to
10. Find the Z-score such that the area under the standard normal curve to the right is 0.22.
The approximate Z-score that corresponds to a right tail area of is ____
11. Determine whether the following graph can represent a normal density function.

Could the graph represent a normal density function?
- No
- Yes
12. Assume the random variable X is normally distributed with mean
and standard deviation
. Compute the probability. Be sure to draw a normal curve with the area corresponding to the probability shaded.
Which of the following normal curves corresponds to

13. The mean incubation time of fertilized eggs is 21 days. Suppose the incubation times are approximately normally distributed with a standard deviation of 1 day.
(a) Determine the 15th percentile for incubation times.
(b) Determine the incubation times that make up the middle 39 %.
(a) The th percentile for incubation times is ___ days. (Round to the nearest whole number as needed.)
(b) The incubation times that make up the middle % are ___ to ___ days. (Round to the nearest whole number as needed. Use ascending order.)
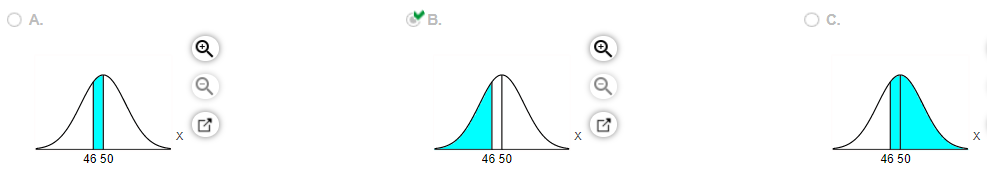
14. The mean gas mileage for a hybrid car is 56 miles per gallon. Suppose that the gasoline mileage is approximately normally distributed with a standard deviation of 3.2 miles per gallon. (a) What proportion of hybrids gets over 62 miles per gallon? (b) What proportion of hybrids gets 52 miles per gallon or less? proportion of hybrids gets between 58 and 61 miles per gallon? (d) What is the probability that a randomly selected hybrid gets less than 46 miles per gallon?
(a) The proportion of hybrids that gets over 62 miles per gallon is ____ (Round to four decimal places as needed.)
(b) The proportion of hybrids that gets miles per gallon or less is ____ (Round to four decimal places as needed.)
(c) The proportion of hybrids that gets between and miles per gallon is ____ (Round to four decimal places as needed.)
(d) The probability that a randomly selected hybrid gets less than miles per gallon is ____ (Round to four decimal places as needed.)
15. Fill in the blank to complete the statement.
The area under the normal curve to the right of
equals _______.
or chat with our tutors