Navigation » List of Schools, Subjects, and Courses » Math 110A – PreCalculus I » Homeworks » Section 2.4 Homework
No Answers We dont have answer to this question yet. If you need help with your homework send us an email  or chat with our tutors
Section 2.4 Homework
Section 2.4 Homework
1. If you travel 500 miles in two hours, then your average speed for the trip is _____ mi/hr
2. The average rate of change of a function f(x) = x2 between x = 1 and x = 7 is
Average rate of change =
3. The graph of a function is given.

(a) Determine the net change between the indicated points on the graph.
(b) Determine the average rate of change between the indicated points on the graph.
4. The graph of a function is given.
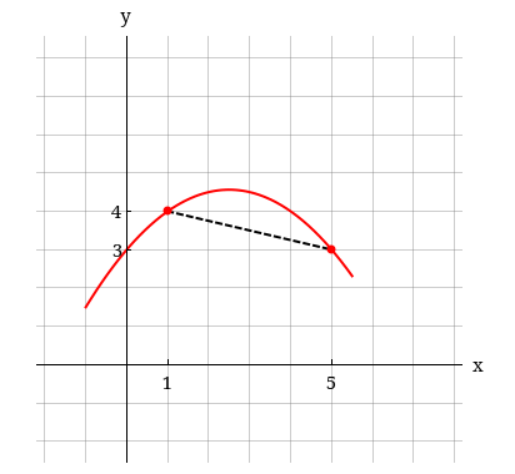
(a) Determine the net change between the indicated points on the graph.
(b) Determine the average rate of change between the indicated points on the graph.
5. The graph of a function is given.
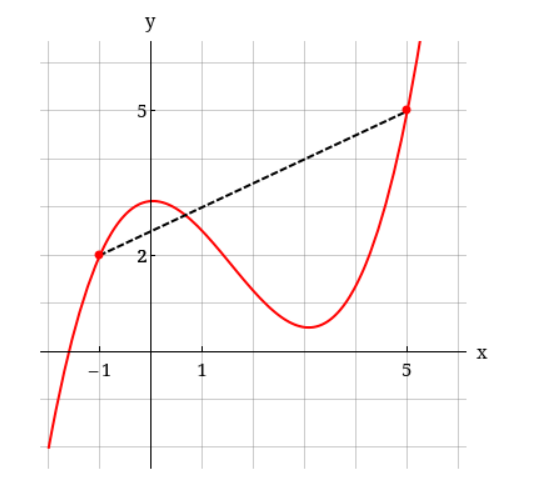
(a) Determine the net change between the indicated points on the graph.
(b) Determine the average rate of change between the indicated points on the graph.
6. A function is given.
(a) Determine the net change between the given values of the variable.
(b) Determine the average rate of change between the given values of the variable.
7. A function is given.
; z=-2, z=0
(a) Determine the net change between the given values of the variable.
(b) Determine the average rate of change between the given values of the variable.
8. A function is given.
(a) Determine the net change between the given values of the variable.
(b) Determine the average rate of change between the given values of the variable.
9. A function is given.
(a) Determine the net change between the given values of the variable.
(b) Determine the average rate of change between the given values of the variable.
10. A function is given.
(a) Determine the net change between the given values of the variable.
(b) Determine the average rate of change between the given values of the variable.
11. A function is given.
(a) Determine the net change between the given values of the variable.
(b) Determine the average rate of change between the given values of the variable.
12. A linear function is given.
(a) Find the average rate of change of the function between x = a and x = a + h.
(b) Find the slope of the line.
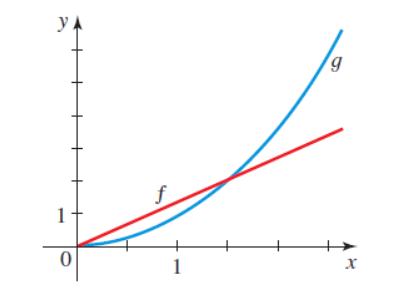
13. The graphs of the functions f and g are shown. The function ___ has a greater average rate of change between x = 0 and x = 1. The function ___ has a greater average rate of change between x = 1 and x = 2. The functions f and g have the same average rate of change between x = ___ and x = ___ .
14. The graph given below shows the population P in a small industrial city from 1950 to 2000. The variable x represents the number of years since 1950.
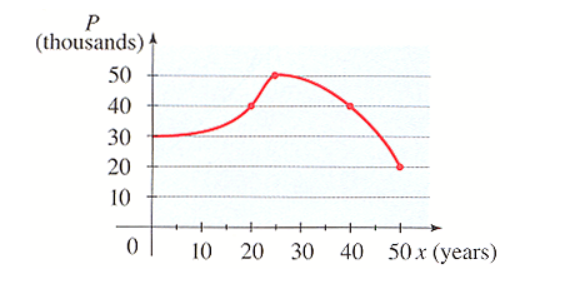
(a) What was the average rate of change of P between x = 20 and x = 40?
(b) Interpret the value of the average rate of change that you found in part (a).
- n.
15. Two speed skaters, A and B, are racing in a 500-m event. The graph shows the distance they have traveled as a function of the time from the start of the race.
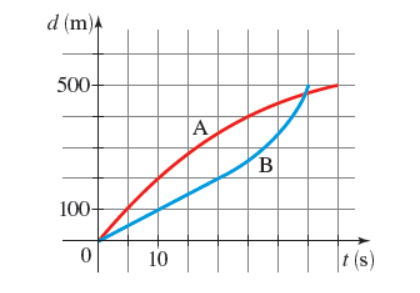
(a) Who won the race?
- Skater A
- Skater B
(b) Find the average speed during the first 10 s for each skater.
Skater A =
Skater B =
(c) Find the average speed during the last 15 s for each skater. (Round each answer to the nearest whole number.)
Skater A =
Skater B =
 or chat with our tutors
