Navigation » List of Schools, Subjects, and Courses » Math 110A – PreCalculus I » Homeworks » Section 2.5 Homework
No Answers We dont have answer to this question yet. If you need help with your homework send us an email  or chat with our tutors
Section 2.5 Homework
Section 2.5 Homework
1. Let f be the linear function f(x) = −9x + 5.

f(x) =
4. Determine whether the given function is linear. If the function is linear, express the function in the form f(x) = ax + b. (If the function is not linear, enter NOT LINEAR.)
5. Determine whether the given function is linear. If the function is linear, express the function in the form f(x) = ax + b. (If the function is not linear, enter NOT LINEAR.)
f(x) =
6. For the given linear function, make a table of values and sketch its graph.
What is the slope of the graph?
7. For the given linear function, make a table of values and sketch its graph.
What is the slope of the graph?
8. A linear function is given.
(a) Sketch the graph.
(b) Find the slope of the graph.
(c) Find the rate of change of the function.
9. A linear function is given.
(a) Sketch the graph.
(b) Find the slope of the graph.
(c) Find the rate of change of the function.
10. A verbal description of a linear function f is given. Express the function f in the form f(x) = ax + b.
and y-intercept -2
11. A table of values for a linear function f is given.
| x | f(x) |
| -3 | 12 |
| 0 | 3 |
| 2 | -3 |
| 5 | -12 |
| 7 | -18 |
(a) Find the rate of change of f.
(b) Express f in the form f(x) = ax + b.
12. The graph of a linear function f is given.

(a) Find the rate of change of f.
(b) Express f in the form f(x) = ax + b.
13. The graph of a linear function f is given.

(a) Find the rate of change of f.
(b) Express f in the form f(x) = ax + b.
14. The amount of copper ore produced from a copper mine in Arizona is modeled by the function
where x is the number of years since 2005 and f(x) is measured in thousands of tons.
(b) What is the slope of the graph?
(c) At what rate is the amount of ore produced changing?
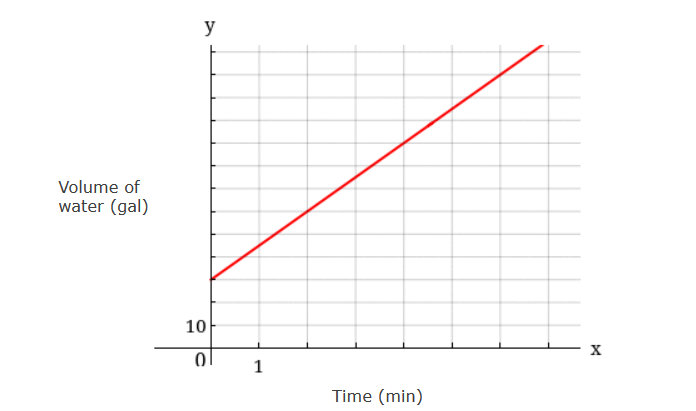
15. Meilin and Brianna are avid mountain bikers. On a spring day they cycle down straight roads with steep grades. The graphs give a representation of the elevation of the road on which each of them cycles. Find the grade of each road.
Brianna ___%
Meilin ____ %

 or chat with our tutors
