
Navigation » List of Schools, Subjects, and Courses » Math 1140 – Introduction to Statistics » Exams » Exam 3
No Answers We dont have answer to this question yet. If you need help with your homework send us an email  or chat with our tutors
Exam 3
Exam 3
1. In a test of the effectiveness of garlic for lowering cholesterol, 81 subjects were treated with raw garlic. Cholesterol levels were measured before and after the treatment. The changes (before minus after) in their levels of LDL cholesterol (in mg/dL) have a mean of 0.3 and a standard deviation of 1.82. Use a 0.01 significance level to test the claim that with garlic treatment, the mean change in LDL cholesterol is greater than 0. What do the results suggest about the effectiveness of the garlic treatment? Assume that a simple random sample has been selected. Identify the null and alternative hypotheses, test statistic, P-value, and state the final conclusion that addresses the original claim.
What are the null and alternative hypotheses?
Determine the test statistic. ____ (Round to two decimal places as needed.)
Determine the P-value. ____ (Round to three decimal places as needed.)
State the final conclusion that addresses the original claim. _____
. There is ________ evidence to conclude that the mean of the population of changes ________ 0.
2. A simple random sample of front-seat occupants involved in car crashes is obtained. Among 2918 occupants not wearing seat belts, 38 were killed. Among 7681
occupants wearing seat belts, 13 were killed. Use a 0.01 significance level to test the claim that seat belts are effective in reducing fatalities. Complete parts (a) through (c) below.
a. Test the claim using a hypothesis test.
Consider the first sample to be the sample of occupants not wearing seat belts and the second sample to be the sample of occupants wearing seat belts. What are the null and alternative hypotheses for the hypothesis test?
Identify the test statistic. z= ______ (Round to two decimal places as needed.)
Identify the P-value. P- value = ______ (Round to three decimal places as needed.)
What is the conclusion based on the hypothesis test? The P-value is ______ the significance level of
so _____ the null hypothesis. There ___ sufficient evidence to support the claim that the fatality rate is higher for those not wearing seat belts.
b. Test the claim by constructing an appropriate confidence interval. The appropriate confidence interval is ______ <
____ (Round to three decimal places as needed.)
What is the conclusion based on the confidence interval?
Because the confidence interval limits _______ 0, it appears that the two fatality rates are ______. Because the confidence interval limits include _____ values, it appears that the fatality rate is _______ for those not wearing seat belts.
c. What do the results suggest about the effectiveness of seat belts?
- The results suggest that the use of seat belts is associated with lower fatality rates than not using seat belts.
- The results suggest that the use of seat belts is associated with higher fatality rates than not using seat belts.
- The results suggest that the use of seat belts is associated with the same fatality rates as not using seat belts.
- The results are inconclusive.
3. A data set lists earthquake depths. The summary statistics are n = 500,
= 5.78km, s = 4.45km. Use a 0.01 significance level to test the claim of a seismologist that these earthquakes are from a population with a mean equal to 5.00. Assume that a simple random sample has been selected. Identify the null and alternative hypotheses, test statistic, P-value, and state the final conclusion that addresses the original claim.
What are the null and alternative hypotheses?
Determine the test statistic. _____ (Round to two decimal places as needed.)
Determine the P-value. _____ (Round to three decimal places as needed.)
State the final conclusion that addresses the original claim. _____
There is _____ evidence to conclude that the mean of the population of earthquake depths is 5.00km _____ correct.
4. Data on the weights (lb) of the contents of cans of diet soda versus the contents of cans of the regular version of the soda is summarized to the right. Assume that the two samples are independent simple random samples selected from normally distributed populations, and do not assume that the population standard deviations are equal. Complete parts (a) and (b) below. Use a 0.01 significance level for both parts.
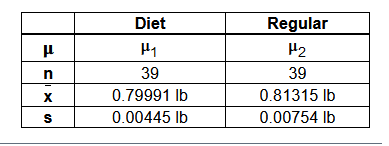
a. Test the claim that the contents of cans of diet soda have weights with a mean that is less than the mean for the regular soda. What are the null and alternative hypotheses?
The test statistic, t, is ________ (Round to two decimal places as needed.)
The P-value is __________. (Round to three decimal places as needed.)
State the conclusion for the test.
- Reject the null hypothesis. There is not sufficient evidence to support the claim that the cans of diet soda have mean weights that are lower than the mean weight for the regular soda.
- Fail to reject the null hypothesis. There is not sufficient evidence to support the claim that the cans of diet soda have mean weights that are lower than the mean weight for the regular soda.
- Reject the null hypothesis. There is sufficient evidence to support the claim that the cans of diet soda have mean weights that are lower than the mean weight for the regular soda.
- Fail to reject the null hypothesis. There is
sufficient evidence to support the claim that the cans of diet soda have mean weights that are lower than the mean weight for the regular soda.
b. Construct a confidence interval appropriate for the hypothesis test in part (a).
________________________________ (Round to three decimal places as needed.)
Does the confidence interval support the conclusion found with the hypothesis test?
______ because the confidence interval contains only negative values.
5. Suppose 234 subjects are treated with a drug that is used to treat pain and 50 of them developed nausea. Use a 0.10 significance level to test the claim that more than 20
% of users develop nausea.
Identify the null and alternative hypotheses for this test. Choose the correct answer below.
Identify the test statistic for this hypothesis test.
The test statistic for this hypothesis test is ______. (Round to two decimal places as needed.)
Identify the P-value for this hypothesis test.
The P-value for this hypothesis test is ______. (Round to three decimal places as needed.)
Identify the conclusion for this hypothesis test.
- Reject
There is ufficient evidence to warrant support of the claim that more than 20% of users develop nausea.
- Reject
There is not sufficient evidence to warrant support of the claim that more than 20% of users develop nausea.
- Fail to reject
There is not sufficient evidence to warrant support of the claim that more than 20% of users develop nausea.
- Fail to reject
. There is sufficient evidence to warrant support of the claim that more than 20% of users develop nausea.
6. Suppose a mutual fund qualifies as having moderate risk if the standard deviation of its monthly rate of return is less than 6%. A mutual-fund rating agency randomly selects 28 months and determines the rate of return for a certain fund. The standard deviation of the rate of return is computed to be 4.11 %.
Is there sufficient evidence to conclude that the fund has moderate risk at the
equals 0.10 level of significance? A normal probability plot indicates that the monthly rates of return are normally distributed.
What are the correct hypotheses for this test?
The null hypothesis is H0: ____________
The alternative hypothesis is H1: _______
Calculate the value of the test statistic.
____. (Round to three decimal places as needed.)
Use technology to determine the P-value for the test statistic.
The P-value is ______. (Round to three decimal places as needed.)
What is the correct conclusion at the
level of significance?
Since the P-value is ____ than the level of significance, ____ the null hypothesis. There ___ sufficient evidence to conclude that the fund has moderate risk at the 0.10 level of significance.
7. Suppose that in a random selection of 100 colored candies, 21% of them are blue. The candy company claims that the percentage of blue candies is equal to 29%.
Use a 0.10 significance level to test that claim.
Identify the null and alternative hypotheses for this test. Choose the correct answer below.
Identify the test statistic for this hypothesis test.
The test statistic for this hypothesis test is _______. (Round to two decimal places as needed.)
Identify the P-value for this hypothesis test.
The P-value for this hypothesis test is _______. (Round to three decimal places as needed.)
Identify the conclusion for this hypothesis test.
- Reject
. There is not sufficient evidence to warrant rejection of the claim that the percentage of blue candies is equal to 29%
- Fail to reject
. There is not sufficient evidence to warrant rejection of the claim that the percentage of blue candies is equal to 29%
- Reject
. There is sufficient evidence to warrant rejection of the claim that the percentage of blue candies is equal to 29%.
- Fail to reject
. There is sufficient evidence to warrant rejection of the claim that the percentage of blue candies is equal to 29%
8. The test statistic of z= 1.29 is obtained when testing the claim that p > 0.9.
a. Identify the hypothesis test as being two-tailed, left-tailed, or right-tailed.
b. Find the P-value.
c. Using a significance level of
=0.01, should we reject
or should we fail to reject
?
a. This is a _____________test.
b. P-value = ______ (Round to three decimal places as needed.)
c. Choose the correct conclusion below.
- Reject
. There is not sufficient evidence to support the claim that p > 0.9
- Fail to reject
. There is not sufficient evidence to support the claim that p > 0.9
- Fail to reject
There is sufficient evidence to support the claim that p > 0.9
- Reject
. There is sufficient evidence to support the claim that p > 0.9.
9. A simple random sample of pulse rates of 30 women from a normally distributed population results in a standard deviation of 10.9 beats per minute. The normal range of pulse rates of adults is typically given as 60 to 100 beats per minute. If the range rule of thumb is applied to that normal range, the result is a standard deviation of 10 beats per minute. Use the sample results with a 0.10 significance level to test the claim that pulse rates of women have a standard deviation equal to 10 beats per minute. Complete parts (a) through (d) below.
a. Identify the null and alternative hypotheses. Choose the correct answer below.
b. Compute the test statistic.
______ (Round to three decimal places as needed.)
c. Find the P-value of the test statistic.
The P-value of the test statistic is _______. (Round to three decimal places as needed.)
d. State the conclusion.
_________
There ________ sufficient evidence to warrant rejection of the claim that pulse rates of women have a standard deviation equal to 10 beats per minute.
10. Test the given claim. Identify the null hypothesis, alternative hypothesis, test statistic, P-value, and then state the conclusion about the null hypothesis, as well as the final conclusion that addresses the original claim. Among 2122 passenger cars in a particular region, 239 had only rear license plates. Among 329 commercial trucks, 47 had only rear license plates. A reasonable hypothesis is that commercial trucks owners violate laws requiring front license plates at a higher rate than owners of passenger cars. Use a 0.10 significance level to test that hypothesis.
a. Test the claim using a hypothesis test.
b. Test the claim by constructing an appropriate confidence interval.
a. Identify the null and alternative hypotheses for this test. Let population 1 correspond to the passenger cars and population 2 correspond to the commercial trucks. Let a success be a vehicle that only has a rear license plate.
Identify the test statistic. _____ (Round to two decimal places as needed.)
Identify the P-value. _______ (Round to three decimal places as needed.)
State the conclusion about the null hypothesis, as well as the final conclusion that addresses the original claim.
Reject
. There is sufficient evidence to support the claim that commercial trucks owners violate laws requiring front license plates at a higher rate than owners of passenger cars.
Fail to reject
. There is not sufficient evidence to support the claim that commercial trucks owners violate laws requiring front license plates at a higher rate than owners of passenger cars.
Reject
. There is not sufficient evidence to support the claim that commercial trucks owners violate laws requiring front license plates at a higher rate than owners of passenger cars.
Fail to reject
. There is sufficient evidence to support the claim that commercial trucks owners violate laws requiring front license plates at a higher rate than owners of passenger cars.
b. Identify the confidence interval limits for the appropriate confidence interval. Let population 1 correspond to the passenger cars and population 2 correspond to the commercial trucks. Let a success be a vehicle that only has a rear license plate.
_________________ (Round to four decimal places as needed.)
Because the confidence interval limits ________ 0, there ____ a significant difference between the two proportions. There ____ sufficient evidence to support the claim that commercial trucks owners violate laws requiring front license plates at a higher rate than owners of passenger cars.
or chat with our tutors