
Navigation » List of Schools, Subjects, and Courses » Math 1140 – Introduction to Statistics » Quiz » Quiz 4 Chapter 6
No Answers We dont have answer to this question yet. If you need help with your homework send us an email  or chat with our tutors
Quiz 4 Chapter 6
Quiz 4 Chapter 6
1. Find the indicated z score. The graph depicts the standard normal distribution with mean 0 and standard deviation 1.
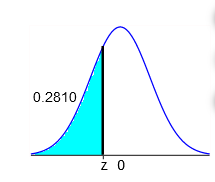
The indicated z score is =
2. Find the indicated z score. The graph depicts the standard normal distribution with mean 0 and standard deviation 1
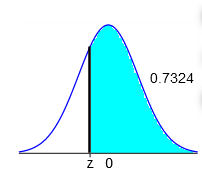
The indicated z score is =
3. Assume that a randomly selected subject is given a bone density test. Those test scores are normally distributed with a mean of 0 and a standard deviation of 1. Find the probability that a given score is less than 2.18 and draw a sketch of the region.
Sketch the region. Choose the correct graph below.
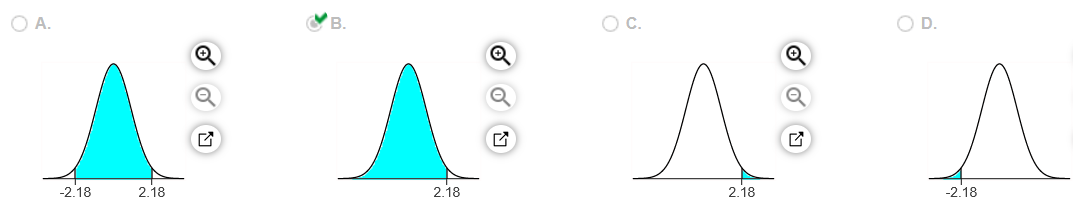
The probability is
4. Assume that a randomly selected subject is given a bone density test. Those test scores are normally distributed with a mean of 0 and a standard deviation of 1. Draw a graph and find the probability of a bone density test score greater than 0.75.
Sketch the region. Choose the correct graph below.
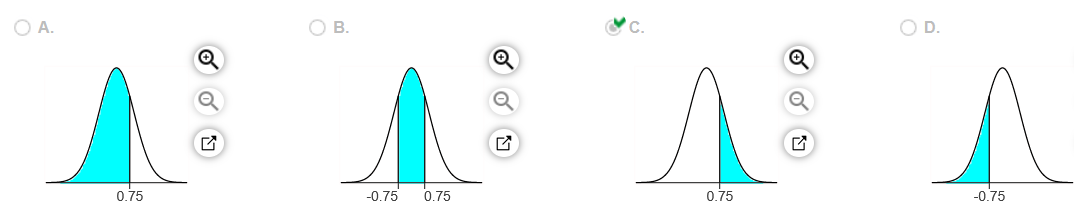
The probability is
5. Assume that a randomly selected subject is given a bone density test. Those test scores are normally distributed with a mean of 0 and a standard deviation of 1. Draw a graph and find the probability of a bone density test score greater than negative 1.79.
Sketch the region. Choose the correct graph below.
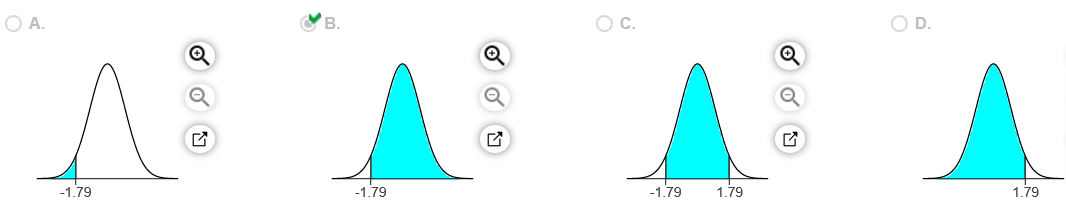
The probability is
6. Assume that a randomly selected subject is given a bone density test. Those test scores are normally distributed with a mean of 0 and a standard deviation of 1. Draw a graph and find the probability of a bone density test score between negative 1.99 and 1.99.
Sketch the region. Choose the correct graph below.

The probability is
7. Pulse rates of women are normally distributed with a mean of 77.5 beats per minute and a standard deviation of 11.6 beats per minute. Answer the following questions.
What are the values of the mean and standard deviation after converting all pulse rates of women to z scores using
The original pulse rates are measure with units of “beats per minute”. What are the units of the corresponding z scores? Choose the correct choice below.
- The z scores are measured with units of “minutes per beat.”
- The z scores are measured with units of “beats per minute.”
- The z scores are measured with units of “beats.”
- The z scores are numbers without units of measurement.
8. Find the area of the shaded region. The graph to the right depicts IQ scores of adults, and those scores are normally distributed with a mean of 100 and a standard deviation of 15.
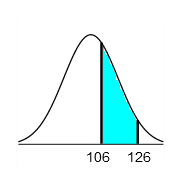
The area of the shaded region is
9. Find the indicated IQ score. The graph to the right depicts IQ scores of adults, and those scores are normally distributed with a mean of 100 and a standard deviation of 15.
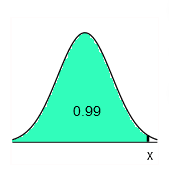
The indicated IQ score, x, is
10. Find the indicated IQ score. The graph to the right depicts IQ scores of adults, and those scores are normally distributed with a mean of 100 and a standard deviation of 15.
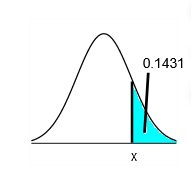
The indicated IQ score is
11. Assume that adults have IQ scores that are normally distributed with a mean of
= 100 and a standard deviation
20. Find the probability that a randomly selected adult has an IQ less than 136.
The probability that a randomly selected adult has an IQ less than 136 is _____
12. Assume that adults have IQ scores that are normally distributed with a mean of 102.2 and a standard deviation of 19.8. Find the probability that a randomly selected adult has an IQ greater than 139.9. (Hint: Draw a graph.)
The probability that a randomly selected adult from this group has an IQ greater than 139.9
13. Assume that adults have IQ scores that are normally distributed with a mean of
=100 and a standard deviation
=20. Find the probability that a randomly selected adult has an IQ between 80 and 120.
The probability that a randomly selected adult has an IQ between 80 and 120 is _________
14. Engineers want to design seats in commercial aircraft so that they are wide enough to fit 99% of all males. (Accommodating 100% of males would require very wide seats that would be much too expensive.) Men have hip breadths that are normally distributed with a mean of 14.4 in. and a standard deviation of 0.8 in. Find
. That is, find the hip breadth for men that separates the smallest 99% from the largest 1%.
The hip breadth for men that separates the smallest 99% from the largest 1% is
15. Assume that adults have IQ scores that are normally distributed with a mean of 98.3 and a standard deviation 17.3. Find the first quartile
, which is the IQ score separating the bottom 25% from the top 75%. (Hint: Draw a graph.)
The first quartile is _________
16. A survey found that women’s heights are normally distributed with mean 63.6in and standard deviation 2.3in. A branch of the military requires women’s heights to be between 58 in and 80 in.
a. Find the percentage of women meeting the height requirement. Are many women being denied the opportunity to join this branch of the military because they are too short or too tall?
b. If this branch of the military changes the height requirements so that all women are eligible except the shortest 1% and the tallest 2%, what are the new height requirements?
a. The percentage of women who meet the height requirement is _____%. (Round to two decimal places as needed.)
Are many women being denied the opportunity to join this branch of the military because they are too short or too tall?
- No, because only a small percentage of women are not allowed to join this branch of the military because of their height.
- Yes, because the percentage of women who meet the height requirement is fairly large.
- Yes, because a large percentage of women are not allowed to join this branch of the military because of their height.
- No, because the percentage of women who meet the height requirement is fairly small.
b. For the new height requirements, this branch of the military requires women’s heights to be at least ____ in and at most ____ in.
(Round to one decimal place as needed.)
17. A survey found that women’s heights are normally distributed with mean 62.9in. and standard deviation 2.3in. The survey also found that men’s heights are normally distributed with mean 68.2 in. and standard deviation 3.7 in. Most of the live characters employed at an amusement park have height requirements of a minimum of 57 in. and a maximum of 62in. Complete parts (a) and (b) below.
a. Find the percentage of men meeting the height requirement. What does the result suggest about the genders of the people who are employed as characters at the amusement park?
The percentage of men who meet the height requirement is _____%. (Round to two decimal places as needed.)
Since most men ____ the height requirement, it is likely that most of the characters are ____ women.
b. If the height requirements are changed to exclude only the tallest 50% of men and the shortest 5% of men, what are the new height requirements?
The new height requirements are a minimum of 62.1 in. and a maximum of 68.20 in. (Round to one decimal place as needed.)
18. Assume that military aircraft use ejection seats designed for men weighing between 139.2 lb and 202lb. If women’s weights are normally distributed with a mean of 175.7 lb and a standard deviation of 40.7lb, what percentage of women have weights that are within those limits? Are many women excluded with those specifications?
The percentage of women that have weights between those limits is _____ %. (Round to two decimal places as needed.)
Are many women excluded with those specifications?
- Yes, the percentage of women who are excluded, which is the complement of the probability found previously, shows that about half of women are excluded.
- Yes, the percentage of women who are excluded, which is equal to the probability found previously, shows that about half of women are excluded.
- No, the percentage of women who are excluded, which is equal to the probability found previously, shows that very few women are excluded.
- No, the percentage of women who are excluded, which is the complement of the probability found previously, shows that very few women are excluded.
19. The lengths of pregnancies are normally distributed with a mean of 269 days and a standard deviation of 15 days. a. Find the probability of a pregnancy lasting 308 days or longer. b. If the length of pregnancy is in the lowest 3%, then the baby is premature. Find the length that separates premature babies from those who are not premature.
a. The probability that a pregnancy will last 308 days or longer is ______. (Round to four decimal places as needed.)
b. Babies who are born on or before ____ days are considered premature. (Round to the nearest integer as needed.)
20. Assume that females have pulse rates that are normally distributed with a mean of
beats per minute and a standard deviation of
= 12.5 beats per minute. Complete parts (a) through (c) below.
a. If 1 adult female is randomly selected, find the probability that her pulse rate is less than 81 beats per minute.
The probability is _______. (Round to four decimal places as needed.)
b. If 4 adult females are randomly selected, find the probability that they have pulse rates with a mean less than 81 beats per minute.
The probability is _______. (Round to four decimal places as needed.)
c. Why can the normal distribution be used in part (b), even though the sample size does not exceed 30?
- Since the original population has a normal distribution, the distribution of sample means is a normal distribution for any sample size.
- Since the distribution is of sample means, not individuals, the distribution is a normal distribution for any sample size.
- Since the distribution is of individuals, not sample means, the distribution is a normal distribution for any sample size.
- Since the mean pulse rate exceeds 30, the distribution of sample means is a normal distribution for any sample size.
21. Assume that females have pulse rates that are normally distributed with a mean of
beats per minute and a standard deviation of
12.5 beats per minute. Complete parts (a) through (c) below.
a. If 1 adult female is randomly selected, find the probability that her pulse rate is between 69 beats per minute and 83 beats per minute.
The probability is _____ (Round to four decimal places as needed.)
b. If 16 adult females are randomly selected, find the probability that they have pulse rates with a mean between 69 beats per minute and 83 beats per minute.
The probability is _____ (Round to four decimal places as needed.)
c. Why can the normal distribution be used in part (b), even though the sample size does not exceed 30?
- Since the original population has a normal distribution, the distribution of sample means is a normal distribution for any sample size.
- Since the mean pulse rate exceeds 30, the distribution of sample means is a normal distribution for any sample size.
- Since the distribution is of individuals, not sample means, the distribution is a normal distribution for any sample size.
- Since the distribution is of sample means, not individuals, the distribution is a normal distribution for any sample size.
22. An elevator has a placard stating that the maximum capacity is 2490lb — 15 passengers. So, 15 adult male passengers can have a mean weight of up to 2490 divided by 15 equals 166 pounds. If the elevator is loaded with 15 adult male passengers, find the probability that it is overloaded because they have a mean weight greater than 166lb. (Assume that weights of males are normally distributed with a mean of 171 lb and a standard deviation of 32 lb.) Does this elevator appear to be safe?
The probability the elevator is overloaded is _______. (Round to four decimal places as needed.)
Does this elevator appear to be safe?
- Yes, 15 randomly selected adult male passengers will always be under the weight limit.
- No, 15 randomly selected people will never be under the weight limit.
- No, there is a good chance that 15 randomly selected adult male passengers will exceed the elevator capacity.
- Yes, there is a good chance that 15 randomly selected people will not exceed the elevator capacity.
23. A ski gondola carries skiers to the top of a mountain. Assume that weights of skiers are normally distributed with a mean of 188 lb and a standard deviation of 35 lb. The gondola has a stated capacity of 25 passengers, and the gondola is rated for a load limit of 3500 lb. Complete parts (a) through (d) below.
a. Given that the gondola is rated for a load limit of 3500 lb, what is the maximum mean weight of the passengers if the gondola is filled to the stated capacity of 25 passengers?
The maximum mean weight is _____ lb. (Type an integer or a decimal. Do not round.)
b. If the gondola is filled with 25 randomly selected skiers, what is the probability that their mean weight exceeds the value from part (a)?
The probability is _____ (Round to four decimal places as needed.)
c. If the weight assumptions were revised so that the new capacity became 20 passengers and the gondola is filled with 20 randomly selected skiers, what is the probability that their mean weight exceeds 175 lb, which is the maximum mean weight that does not cause the total load to exceed 3500 lb?
The probability is ______ (Round to four decimal places as needed.)
d. Is the new capacity of 20 passengers safe?
‘
Since the probability of overloading is ______ , the new capacity _______ to be safe enough.
24. The weights of a certain brand of candies are normally distributed with a mean weight of 0.8604g and a standard deviation of 0.0521 g. A sample of these candies came from a package containing 440 candies, and the package label stated that the net weight is 375.4g. (If every package has 440 candies, the mean weight of the candies must exceed
for the net contents to weigh at least 375.4g.)
a. If 1 candy is randomly selected, find the probability that it weighs more than 0.8532g.
The probability is ___________ (Round to four decimal places as needed.)
b. If 440 candies are randomly selected, find the probability that their mean weight is at least 0.8532g.
The probability that a sample of 440 candies will have a mean of 0.8532g or greater is ________ (Round to four decimal places as needed.)
c. Given these results, does it seem that the candy company is providing consumers with the amount claimed on the label?
_______ because the probability of getting a sample mean of 0.8532g or greater when 440 candies are selected __________ exceptionally small.
25. Which of the following is NOT a conclusion of the Central Limit Theorem? Choose the correct answer below.
- The standard deviation of all sample means is the population standard deviation divided by the square root of the sample size.
- The mean of all sample means is the population mean
- The distribution of the sample means
will, as the sample size increases, approach a normal distribution.
- The distribution of the sample data will approach a normal distribution as the sample size increases.
or chat with our tutors