
Navigation » List of Schools, Subjects, and Courses » Math 138 – Statistics » Homeworks » Section 7.1 Homework
No Answers We dont have answer to this question yet. If you need help with your homework send us an email  or chat with our tutors
Section 7.1 Homework
Section 7.1 Homework
1. The following figure is a probability density curve that represents the grade point averages (GPA) of the graduating seniors at a large university.
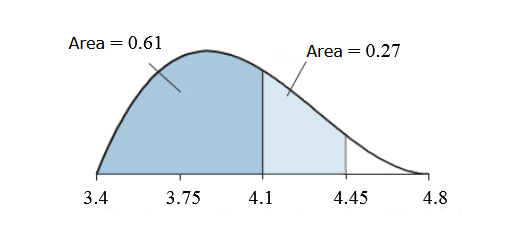
Find the proportion of seniors whose GPA is between 4.1 and 4.45.
The proportion of seniors whose GPA is between 4.1 and 4.45 is ________ .
What is the probability that a randomly chosen senior will have a GPA greater than 4.45?
The probability that a randomly chosen senior will have a GPA greater than 4.45 is ______
2. The following figure is a normal curve that represents the approximate heights, in inches, of adult women in the United States.
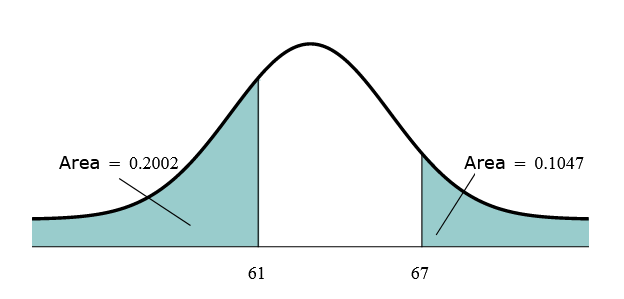
(a) Find the proportion of women who are more than 61 inches tall.
The proportion of women who are more than 61 inches tall is ______
(b) Find the proportion of women who are less than 67 inches tall.
The proportion of women who are less than 67 inches tall is ____________
(c) Find the proportion of women who are between 61 and 67 inches tall.
The proportion of women who are between 61 and 67 inches tall is _______
3. A normal distribution has mean
and standard deviation
. Find and interpret the z-score for x=55
The z-score for x=55 is ______. So 55 is ____ standard deviations ____ the mean
.
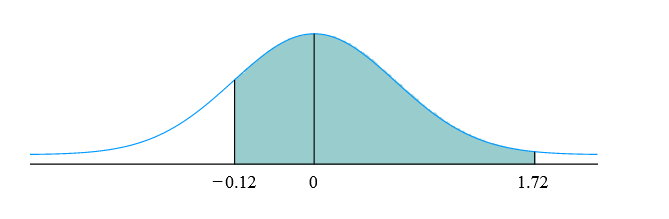
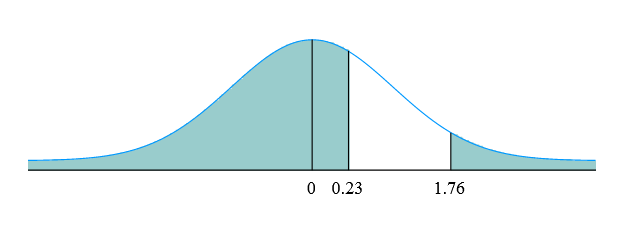
4. Find each of the shaded areas under the standard normal curve using a TI-84 Plus calculator. Round the answers to at least four decimal places.
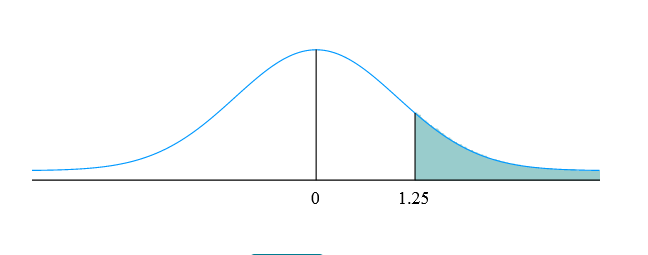
The area of the shaded region is _____
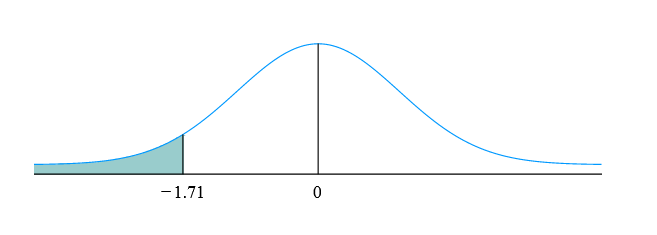
The area of the shaded region is _____
The area of the shaded region is _____
The area of the shaded region is _______
.
5. Use the TI-84 Plus calculator to find the z-score for which the area to its left is 0.78. Round the answer to two decimal places.
The z-score for the given area is _____
6. Use the TI-84 Plus calculator to find the z-score for which the area to its right is 0.59. Round the answer to two decimal places.
The z-score for the given area is ____
7. Use the TI-84 Plus calculator to find the z-scores that bound the middle 70% of the area under the standard normal curve. Enter the answers in ascending order and round to two decimal places.
The z-scores for the given area are ____ and ____
.
or chat with our tutors