
Navigation » List of Schools, Subjects, and Courses » Math 136 – Introduction to Statistics » Exams » Exam 4
No Answers We dont have answer to this question yet. If you need help with your homework send us an email  or chat with our tutors
Exam 4
Exam 4
1. The null and alternative hypotheses are given. Determine whether the hypothesis test is left-tailed, right-tailed, or two-tailed and the parameter that is being tested.
- Two-tailed,
- Right-tailed,
- Two-tailed,
- Left-tailed,
2. In a clinical trial, 2.222 out of 827 patients taking a prescription drug daily complained of flulike symptoms. Suppose that it is known that % of patients taking competing drugs complain of flulike symptoms. Is there sufficient evidence to conclude that more than 2.2% of this drug’s users experience flulike symptoms as a side effect at the
level of significance?
Because
the sample size is ______ 5% of the population size, and the sample _____________________, the requirements for testing the hypothesis _______ satisfied. (Round to one decimal place as needed.)
What are the null and alternative hypotheses?
(Type integers or decimals. Do not round.)
Find the test statistic,
(Round to two decimal places as needed.)
Find the P-value.
P-value = _____ (Round to three decimal places as needed.)
Choose the correct conclusion below.
- Since P-value
, the null hypothesis and conclude that there sufficient evidence that more th.2an 2 % of the users experience flulike symptoms.
- Since P-value
, the null hypothesis and conclude that there sufficient evidence that more than 2.2% of the users experience flulike symptoms.
- Since P-value
, the null hypothesis and conclude that there sufficient evidence that more than 2.2% of the users experience flulike symptoms.
- Since P-value <
, the null hypothesis and conclude that there sufficient evidence that more than 2.2% of the users experience flulike symptoms.
3. Determine the standardized test statistic, z, to test the claim about the population proportion p = 0.250 given n=48 and
. Use
- -0.23
- -1.18
- -0.304
- -2.87
4. What is a Type II error?
- An error that rejects
, given that
is true.
- An error that rejects
, given that
is false.
- An error that fails to reject
, given that
is true.
- An error that fails to reject
, given that
is false.
5. A college entrance exam company determined that a score of 23 on the mathematics portion of the exam suggests that a student is ready for college-level mathematics. To achieve this goal, the company recommends that students take a core curriculum of math courses in high school. Suppose a random sample of 150 students who completed this core set of courses results in a mean math score of 23.3 on the college entrance exam with a standard deviation of 3.2. Do these results suggest that students who complete the core curriculum are ready for college-level mathematics? That is, are they scoring above 23 on the math portion of the exam? Complete parts a) through d) below.
a) State the appropriate null and alternative hypotheses. Fill in the correct answers below.
The appropriate null and alternative hypotheses are
____________ versus
b) Verify that the requirements to perform the test using the t-distribution are satisfied. Check all that apply.
- The sample size is larger than 30
- The students were randomly sampled
- The students’ test scores were independent with each other
- None of the requirements are satisfied.
d) Write a conclusion based on the results. Choose the correct answer below.
_________ the null hypothesis and claim that there ______ sufficient evidence to conclude that the population mean is ______ 23.
6. If
is computed to be 0.763, what is the power of the test?
- 0.237
- 0.263
- 0.737
- 0.763
7. Fill in the blanks to complete the statement.
The _______ _______ is a statement .
8. What represents the probability of making a Type II error?
9. A study was conducted to determine if the salaries of librarians from two neighboring cities were equal. A sample of 15 librarians from each city was randomly selected. The mean from the first city was $28,900 with a standard deviation of $2300. The mean from the second city was $30,300 with a standard deviation of $2100. Construct a 95% confidence interval for
- (-4081, 597)
- (-3048, 248)
- (-2976, 176)
- (-2871, 567)
10. Classify the two given samples as independent or dependent.
Sample 1: Pre-training blood pressure of 25 people
Sample 2: Post-training blood pressure of 25 people
- dependent
- independent
11. Do people walk faster in the airport when they are departing (getting on a plane) or do they walk faster when they are arriving (getting off a plane)? A reputable researcher measured the walking speed of random travelers in two International Airports. His findings are summarized in the table. Complete parts (a)-(c) below.
(a) Is this an observational study or a designed experiment? Why?
- This is an observational study since the researcher did not influence the data.
- This is a designed experiment since the researcher influenced the data.
- This is a designed experiment since the researcher did not influence the data.
- This is an observational study since the researcher influenced the data.
(b) Explain why it is reasonable to use Welch’s t-test.
- The populations are normally distributed.
- The samples are random, large and independent.
- The samples are random, small and independent.
- The samples are random, large and dependent.
(c) Do individuals walk at different speeds depending on whether they are departing or arriving at the
level of significance? Let
represent the mean speed of people departing and
represent the mean speed of people arriving.
State the null and alternative hypothesis. 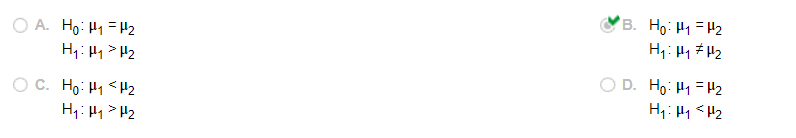
12. A golf association requires that golf balls have a diameter that is 1.68 inches. To determine if golf balls conform to the standard, a random sample of golf balls was selected. Their diameters are shown in the accompanying data table. Do the golf balls conform to the standards? Use the
level of significance.
First determine the appropriate hypotheses.
Find the test statistic. ______ (Round to two decimal places as needed.)
Find the P-value. ______ (Round to three decimal places as needed.)
What can be concluded from the hypothesis test?
What can be concluded from the hypothesis test?
- Do not reject
. There is not sufficient evidence to conclude that the golf balls do not conform to the association’s standards at the level of significance.
- Do not reject . There is sufficient evidence to conclude that the golf balls do not conform to the association’s standards at the level of significance.
- Reject . There is sufficient evidence to conclude that the golf balls do not conform to the association’s standards at the level of significance.
- Reject . There is not sufficient evidence to conclude that the golf balls do not conform to the association’s standards at the level of significance.
13. If the null hypothesis is not rejected when the null hypothesis is in error, what type of error, if any, has been made?
- Correct Decision
- Type
error
- Type II error
- Type I error
14. In randomized, double-blind clinical trials of a new vaccine, were randomly divided into two groups. Subjects in group 1 received the new vaccine while subjects in group 2 received a control vaccine. After the second dose, 114 of 727 subjects in the experimental group (group 1) experienced as a side effect. After the second dose, 71 of 608 of the subjects in the control group (group 2) experienced as a side effect. Does the evidence suggest that a higher proportion of subjects in group 1 experienced as a side effect than subjects in group 2 at the level of significance?
Verify the model requirements. Select all that apply.
Determine the null and alternative hypotheses.
Find the test statistic for this hypothesis test. ______ (Round to two decimal places as needed.)
Determine the P-value for this hypothesis test. _____ (Round to three decimal places as needed.)
Interpret the P-value.
If the population proportions are ______, one would expect a sample difference proportion _____________ the one observed in about _____ out of 1000 repetitions of this experiment. (Round to the nearest integer as needed.)
State the conclusion for this hypothesis test.
- Do not reject
. There is sufficient evidence to conclude that a higher proportion of subjects in group 1 experienced as a side effect than subjects in group 2 at the
level of significance.
- Reject
There is not sufficient evidence to conclude that a higher proportion of subjects in group 1 experienced as a side effect than subjects in group 2 at the
level of significance.
- Do not reject
There is not sufficient evidence to conclude that a higher proportion of subjects in group 1 experienced as a side effect than subjects in group 2 at
the level of significance.
- Reject
There is sufficient evidence to conclude that a higher proportion of subjects in group 1 experienced as a side effect than subjects in group 2 at the
level of significance.
15. What is the probability associated with not making a Type II error?
16. The ______________ hypothesis contains the ” = ” sign.
- null
- alternative
- explanatory
- conditional
17. The null and alternative hypotheses are given. Determine whether the hypothesis test is left-tailed, right-tailed, or two-tailed and the parameter that is being tested.
- Right-tailed,
- Left-tailed, s
- Right-tailed,
- Left-tailed,
18. What is the power of a test?
19. Classify the two given samples as independent or dependent.
Sample 1: The scores of 28 students who took a statistics final
Sample 2: The scores of 28 different students who took a physics final
- dependent
- independent
20. The level of significance,
, is the probability of making what?
- A type I error
- A type II error
- A correct decision
- A type
error
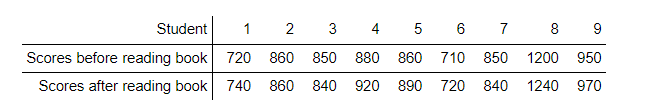
21. Nine students took the SAT. Their scores are listed below. Later on, they read a book on test preparation and retook the SAT. Their new scores are listed below. Construct a 95% confidence interval for
. Assume that the differences are normally distributed.
- (1.651, 30.590)
- (-20.341, 4.852)
- (-10.321, 15.436)
- (-30.496,-0.615)
22. If the null hypothesis is rejected when the null hypothesis is true, what type of error, if any, has been made?
- Type I error
- Type II error
- Correct decision
- Type
error
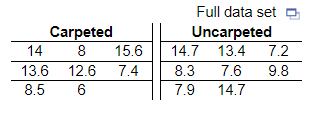
23. A researcher wanted to determine if carpeted or uncarpeted rooms contain more bacteria. The table shows the results for the number of bacteria per cubic foot for both types of rooms. A normal probability plot and boxplot indicate that the data are approximately normally distributed with no outliers. Do carpeted rooms have more bacteria than uncarpeted rooms at the
level of significance?
What are the null and alternative hypotheses?
Calculate the test statistic,
.
(Round to two decimal places as needed.)
Now find the critical value. Select the correct choice below and fill in the answer box within your choice. (Round to three decimal places as needed.)
Do carpeted rooms have more bacteria than uncarpeted rooms at the
level of significance?
- No, because the test statistic is in the critical region.
- No, because the test statistic is in the critical region.
- Yes, because the test statistic is not in the critical region.
- Yes, because the test statistic is in the critical region.
or chat with our tutors